Joined: 05 Aug 2009
Posts: 611
Location: Where the wind comes sweeping down the plains
PostPosted: Mon Oct 25, 2010 4:06 pm Post subject: Advanced Statistical Plus/Minus: 2010-2011 Projections Reply with quote
Advanced Statistical Plus/Minus 2010-2011 Projections
Ever since I posted the historical ASPM numbers over on the development thread, I knew I had to try my hand at creating a projection system.
The basic idea: use a Marcel-type system, with a few additions.
I created a Bayesian Prior (instead of regressing to league mean), based on the team's efficiency differential and the player's (regressed) MPG. I use the last 5 team-season instances for the projections. There is a basic weight reduction factor for years ago, and also a weight reduction factor for changing teams.
First, I created the regressed Bayesian Prior, based on the information mentioned and a modified aging curve. The weight for this varies, but usually is in the area of 300 minutes (depending on games played, MPG, etc.). There is also a league-wide regression to a fixed number (near replacement level), weighted at about 120 minutes (the weights were found with Solver). Finally, the player's actual ASPM history is weighted based on minutes, team change, and years ago, and modified by the aging curve.
Here is the ASPM aging curve:
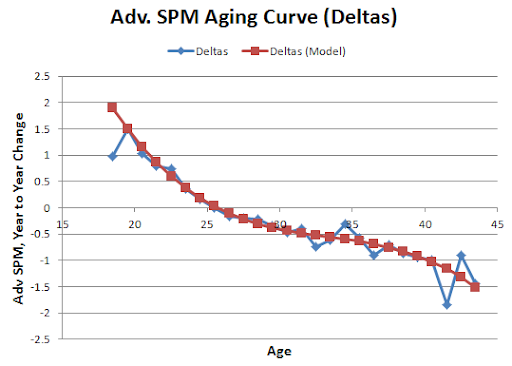
The model is a cubic, and the points were weighted by number of observations. The deltas themselves are Regressed Y compared with Y+1 and Regressed Y+1 compared with Y, for all instances where the player had a minimum of 100 Minutes in both seasons. So there could be some selection bias--the regressing should help some, though.
More coming as I type it.
_________________
GodismyJudgeOK.com/DStats
Twitter.com/DSMok1
Back to top
View user's profile Send private message Send e-mail Visit poster's website
DSMok1
Joined: 05 Aug 2009
Posts: 611
Location: Where the wind comes sweeping down the plains
PostPosted: Mon Oct 25, 2010 4:17 pm Post subject: Reply with quote
I'm sure some would be interested in the actual model deltas shown in the graph above:
Code:
Delta Age Deltas (Model)
18.5 1.898
19.5 1.506
20.5 1.162
21.5 0.861
22.5 0.601
23.5 0.378
24.5 0.188
25.5 0.029
26.5 -0.103
27.5 -0.212
28.5 -0.300
29.5 -0.372
30.5 -0.431
31.5 -0.479
32.5 -0.521
33.5 -0.560
34.5 -0.599
35.5 -0.641
36.5 -0.691
37.5 -0.751
38.5 -0.824
39.5 -0.915
40.5 -1.026
41.5 -1.162
42.5 -1.324
43.5 -1.517
I also generated projections for drafted players, using a method of percentiles (in other words, assuming for later-round players that I was observing the top portion of a normal distribution).
(That's for the rookies)
Here are the top 20 players by this projection:
Code:
Name Team Proj. SPM StdErr
LeBron James MIA 11.72 2.13
Chris Paul NOH 10.17 1.69
Dwyane Wade MIA 9.04 1.65
Kevin Durant OKC 5.86 1.65
Dwight Howard ORL 5.59 1.65
Rajon Rondo BOS 4.78 1.65
Kobe Bryant LAL 4.62 1.65
Tim Duncan SAS 4.30 1.66
Manu Ginobili SAS 4.28 1.71
Brandon Roy POR 4.23 1.66
Deron Williams UTA 4.20 1.65
Josh Smith ATL 4.10 1.65
Dirk Nowitzki DAL 3.93 1.65
Pau Gasol LAL 3.72 1.67
Chris Bosh MIA 3.65 2.28
Kevin Garnett BOS 3.62 1.71
Gerald Wallace CHA 3.57 1.65
Al Horford ATL 3.39 1.66
Carmelo AnthonyDEN 3.35 1.65
Nene Hilario DEN 3.19 1.67
More coming...
_________________
GodismyJudgeOK.com/DStats
Twitter.com/DSMok1
Back to top
View user's profile Send private message Send e-mail Visit poster's website
DSMok1
Joined: 05 Aug 2009
Posts: 611
Location: Where the wind comes sweeping down the plains
PostPosted: Mon Oct 25, 2010 4:26 pm Post subject: Reply with quote
Team Projections:
Code:
Team Margin Wins
Miami 8.70 62.4
Portland 6.26 56.3
San Antonio 5.02 53.9
Orlando 3.98 51.7
Denver 3.60 50.2
LA Lakers 2.95 48.5
Chicago 2.69 50.3
Atlanta 2.55 49.2
Boston 2.38 49.0
Utah 2.29 47.2
New Orleans 2.02 46.3
Oklahoma City 2.00 47.0
Phoenix 1.30 44.6
Dallas 0.90 43.7
Golden State 0.39 42.1
Houston -0.07 41.5
Memphis -0.59 40.3
Milwaukee -1.66 38.8
Philadelphia -2.60 35.9
New York -2.80 35.0
Detroit -2.93 35.1
Charlotte -2.94 35.3
Cleveland -3.04 35.5
New Jersey -3.60 33.5
Washington -3.75 33.1
Indiana -3.98 32.6
Sacramento -4.24 31.3
Minnesota -4.63 30.4
LA Clippers -4.84 29.6
Toronto -5.36 29.5
Wins are calculated based on the schedule, including adjustment for rest days.
One note: There was no projection for Tiago Splitter (too long since draft), and I manually chose to consider him as a +0.00 league-average player.
EDIT: I have gone with a less conservative playing time projection; new projections are below.
_________________
GodismyJudgeOK.com/DStats
Twitter.com/DSMok1
Last edited by DSMok1 on Tue Oct 26, 2010 11:47 am; edited 1 time in total
Back to top
View user's profile Send private message Send e-mail Visit poster's website
DSMok1
Joined: 05 Aug 2009
Posts: 611
Location: Where the wind comes sweeping down the plains
PostPosted: Mon Oct 25, 2010 5:01 pm Post subject: Reply with quote
I'm out of time for this, but here are the full projections:
Projections HERE
_________________
GodismyJudgeOK.com/DStats
Twitter.com/DSMok1
Last edited by DSMok1 on Tue Oct 26, 2010 11:47 am; edited 1 time in total
Back to top
View user's profile Send private message Send e-mail Visit poster's website
DSMok1
Joined: 05 Aug 2009
Posts: 611
Location: Where the wind comes sweeping down the plains
PostPosted: Tue Oct 26, 2010 11:46 am Post subject: Reply with quote
Update: Cross posted from wins projection thread:
Advanced SPM projections for the league win totals, adjusting for strength of schedule and rest days:
Code:
TM Margin Rest SoS Total Team Wins
MIA 11.84 -0.11 -0.71 12.45 Miami 68.5
POR 5.57 -0.05 0.10 5.43 Portland 54.9
SAS 4.74 0.10 0.06 4.78 San Antonio 53.4
ORL 3.92 -0.18 -0.29 4.04 Orlando 51.5
ATL 3.57 -0.07 -0.36 3.85 Atlanta 51.1
BOS 3.00 0.02 -0.42 3.44 Boston 50.0
LAL 3.49 -0.18 -0.01 3.32 LA Lakers 49.7
DEN 3.27 -0.11 0.01 3.14 Denver 49.3
CHI 2.31 0.23 -0.47 3.01 Chicago 48.9
UTA 2.78 -0.01 0.11 2.66 Utah 48.0
OKC 2.36 0.12 0.00 2.47 Oklahoma City 47.5
NOH 2.36 0.01 0.21 2.15 New Orleans 46.7
DAL 1.06 0.08 0.24 0.91 Dallas 43.4
PHO 0.45 0.01 0.27 0.19 Phoenix 41.5
GSW 0.28 -0.17 0.14 -0.03 Golden State 40.9
MIL -0.78 0.21 -0.10 -0.47 Milwaukee 39.8
HOU -0.64 -0.04 0.12 -0.80 Houston 38.9
MEM -0.88 0.06 0.16 -0.98 Memphis 38.4
CHA -2.32 0.13 -0.01 -2.19 Charlotte 35.2
PHI -2.46 -0.17 -0.21 -2.41 Philadelphia 34.6
NYK -2.81 -0.19 0.00 -3.01 New York 33.1
CLE -3.51 0.24 -0.05 -3.22 Cleveland 32.5
NJN -3.69 -0.03 -0.08 -3.65 New Jersey 31.4
DET -3.78 -0.04 0.02 -3.84 Detroit 31.0
SAC -4.35 0.11 0.38 -4.62 Sacramento 29.0
IND -4.65 -0.09 -0.09 -4.65 Indiana 29.0
WAS -4.61 0.03 0.12 -4.70 Washington 28.8
LAC -5.09 -0.10 0.30 -5.49 LA Clippers 26.9
TOR -5.69 -0.02 0.05 -5.76 Toronto 26.3
MIN -5.74 0.20 0.52 -6.06 Minnesota 25.6
I personally think there will be significant diminishing returns for Miami; nearly all of the player's contributions above average are on the offensive side of the ball. It would require Miami to maintain a near-historic level of offense (rivaling Dallas in, what was it, 2005?) to actually achieve this level. That's what the projections say, though, so I'll stick to it. I think they may lost a point or 2 of that margin in actuality, but they may be able to compensate with greater effort on defense.
I manually put in Tiago Splitter as a league-average player; all other players without projections come in at replacement level, which I estimate at -3.5 (rather than the commonly accepted -3.0).
Full updated projections here:
Advanced SPM Player and Team Projections
_________________
GodismyJudgeOK.com/DStats
Twitter.com/DSMok1
Back to top
View user's profile Send private message Send e-mail Visit poster's website
DSMok1
Joined: 05 Aug 2009
Posts: 611
Location: Where the wind comes sweeping down the plains
PostPosted: Tue Oct 26, 2010 1:49 pm Post subject: Reply with quote
Someone asked how to generate an expected score in a game from the margin I showed:
Efficiency margin is listed in points per 100 possessions. So if Miami, with a +11.8 margin, played OKC, with a +2.4 Margin, Miami would be expected to outscore OKC by 9.4 points per 100 possessions.
Now, an average NBA team scores something like 107.6 points per 100 possessions. An average NBA team has 92.6 possessions per game. So I'd look at how fast the teams play and generate an expected number of possessions: Team1Pace*Team2Pace/LeagueAveragePace (For pace numbers, see Basketball Reference: http://www.basketball-reference.com/lea ... _2010.html and look at the Misc. Statistics.
So, suppose OKC averages 93.1 possessions and Miami 89.6. Expected would be 90.0 possessions. Expected score would be (107.6+9.4/2)*(90.0/100) to (107.6-9.4/2)*(90.0/100), or 101 to 93 or so.
Now, sometimes teams just play lower scoring per possession games or higher scoring per possession games (Golden State sacrificed defense for offense; their games averaged 109.9 pts/100 possessions. So I would adjust for that as well to get a good estimate of a final score. If we assume both OKC and Miami's offenses are as good as their defenses, the calculation I did would be right.
BTW: as a statistician, betting is really dumb, so please don't use any of these numbers for that.
_________________
GodismyJudgeOK.com/DStats
Twitter.com/DSMok1
Back to top
View user's profile Send private message Send e-mail Visit poster's website
BobboFitos
Joined: 21 Feb 2009
Posts: 201
Location: Cambridge, MA
PostPosted: Wed Oct 27, 2010 2:23 am Post subject: Reply with quote
DSMok1 wrote:
BTW: as a statistician, betting is really dumb, so please don't use any of these numbers for that.
I don't quite understand this comment - shouldn't betting be more important to you as a statistician?
_________________
http://pointsperpossession.com/
@PPPBasketball
Back to top
View user's profile Send private message
DSMok1
Joined: 05 Aug 2009
Posts: 611
Location: Where the wind comes sweeping down the plains
PostPosted: Wed Oct 27, 2010 8:23 am Post subject: Reply with quote
BobboFitos wrote:
DSMok1 wrote:
BTW: as a statistician, betting is really dumb, so please don't use any of these numbers for that.
I don't quite understand this comment - shouldn't betting be more important to you as a statistician?
I'm saying: from a statistical viewpoint, it is foolish to bet. The house gets the juice; it's pretty near impossible to make up for that. Also, I personally think it's not good to bet. So I'm asking that no one use these projections as a basis for betting.
Smile
_________________
GodismyJudgeOK.com/DStats
Twitter.com/DSMok1
Back to top
View user's profile Send private message Send e-mail Visit poster's website
BobboFitos
Joined: 21 Feb 2009
Posts: 201
Location: Cambridge, MA
PostPosted: Wed Oct 27, 2010 8:50 am Post subject: Reply with quote
DSMok1 wrote:
BobboFitos wrote:
DSMok1 wrote:
BTW: as a statistician, betting is really dumb, so please don't use any of these numbers for that.
I don't quite understand this comment - shouldn't betting be more important to you as a statistician?
I'm saying: from a statistical viewpoint, it is foolish to bet. The house gets the juice; it's pretty near impossible to make up for that. Also, I personally think it's not good to bet. So I'm asking that no one use these projections as a basis for betting.
Smile
Ah, gotcha.
_________________
http://pointsperpossession.com/
@PPPBasketball
Back to top
View user's profile Send private message
DSMok1
Joined: 05 Aug 2009
Posts: 611
Location: Where the wind comes sweeping down the plains
PostPosted: Wed Nov 10, 2010 1:46 pm Post subject: Reply with quote
I am putting up a spreadsheet that:
1: Calculates ASPM for this year
2: Regresses each player based on a Bayesian prior, to provide an estimated "true talent" level for this year alone.
3: Updates player projections for everyone who has played this year. This provides the most accurate "true talent" estimate currently.
4: Provides a single-game projection.
The spreadsheet is an XLSM file on Google Docs (macro required to update data from the web.)
Updated spreadsheet here!
_________________
GodismyJudgeOK.com/DStats
Twitter.com/DSMok1
Back to top
View user's profile Send private message Send e-mail Visit poster's website
inkt2002
Joined: 10 Oct 2009
Posts: 8
PostPosted: Wed Nov 10, 2010 1:59 pm Post subject: Reply with quote
DSMok1 wrote:
I am putting up a spreadsheet that:
1: Calculates ASPM for this year
2: Regresses each player based on a Bayesian prior, to provide an estimated "true talent" level for this year alone.
3: Updates player projections for everyone who has played this year. This provides the most accurate "true talent" estimate currently.
4: Provides a single-game projection.
The spreadsheet is an XLSM file on Google Docs (macro required to update data from the web.)
Updated spreadsheet here!
Wow, this looks absolutely incredible! Thanks for sharing!
Back to top
View user's profile Send private message
Ilardi
Joined: 15 May 2008
Posts: 265
Location: Lawrence, KS
PostPosted: Sun Nov 28, 2010 3:17 pm Post subject: Reply with quote
DSMok1 wrote:
I am putting up a spreadsheet that:
1: Calculates ASPM for this year
2: Regresses each player based on a Bayesian prior, to provide an estimated "true talent" level for this year alone.
3: Updates player projections for everyone who has played this year. This provides the most accurate "true talent" estimate currently.
4: Provides a single-game projection.
The spreadsheet is an XLSM file on Google Docs (macro required to update data from the web.)
Updated spreadsheet here!
DSM,
This is great work. Hey, when you have a minute, would you be willing to expound a bit on exactly how you regressed each player on a Bayesian prior to get the 'true talent' estimates?
Back to top
View user's profile Send private message
DSMok1
Joined: 05 Aug 2009
Posts: 611
Location: Where the wind comes sweeping down the plains
PostPosted: Mon Nov 29, 2010 1:41 pm Post subject: Reply with quote
From another conversation:
Quote:
I had a question about your model. I see how you separated offense and defensive ratings, but do not see the column where the offensive rating and defensive rating add up to the players total rating.
For example, you currently rate Lebron James 9.87. I was wondering what two columns (offense and defense) will add to that amount. As always, thanks so much.
The Rosters tab is where the calculations occur. I have 3 separate regressions: ASPM, offensive ASPM, and defensive ASPM. Those are columns AI, AU, and BF. The overall regression is more accurate, so I then average the ASPM with the sum of the other 2 at a 2/1 ratio (column BK). I then back-calculate the adjusted OSPM and DSPM which is forced to sum to that number (column BN and BQ). Those are the raw numbers.
Then, I regress each based on BV, BW, and BX. The regressed numbers are more accurate (basically, they adjust for noise/randomness within the season). Those numbers are BZ, CB, and CD. Those are the best numbers accounting only for this season.
I only did a projection for the overall SPM, so I only updated true talent numbers for SPM as a whole (CS).
_________________
GodismyJudgeOK.com/DStats
Twitter.com/DSMok1
Back to top
View user's profile Send private message Send e-mail Visit poster's website
erivera7
Joined: 19 Jan 2009
Posts: 185
Location: Chicago, IL
PostPosted: Tue Dec 07, 2010 10:29 pm Post subject: Reply with quote
How often will updates be posted?
_________________
@erivera7
I cover the Orlando Magic - Magic Basketball
Back to top
View user's profile Send private message
DSMok1
Joined: 05 Aug 2009
Posts: 611
Location: Where the wind comes sweeping down the plains
PostPosted: Wed Dec 08, 2010 9:34 am Post subject: Reply with quote
erivera7 wrote:
How often will updates be posted?
The updated spreadsheet, above, updates automatically when you push the big button on the Rosters tab. Smile
This is pulled straight out of the spreadsheet:
Code:
Player Preseason This Year Updated Proj.
Dwight Howard 5.59 5.10 5.45
Jameer Nelson 1.69 5.61 2.58
Vince Carter 1.87 3.27 2.22
Rashard Lewis 1.58 0.41 1.25
Marcin Gortat -0.15 1.56 0.27
Brandon Bass -1.23 2.12 0.05
Ryan Anderson 0.46 -4.49 -0.04
Quentin Richardson -1.07 0.83 -0.27
J.J. Redick -0.02 -1.36 -0.29
Mickael Pietrus -0.85 -0.90 -0.86
Jason Williams -1.25 -1.44 -1.27
Chris Duhon -2.98 -4.45 -3.51
Malik Allen -4.73 -0.77 -4.54
ASPM struggles somewhat with Orlando, because there's a ton of defensive value and it's hard to figure out who contributed it (there's a large defensive team adjustment).
I'll post an updated spreadsheet soon, with a couple of new features hopefully: an updated single-game prediction system, and a single-game analysis of past games to assign credit.
_________________
GodismyJudgeOK.com/DStats
Twitter.com/DSMok1
recoverd page 2
Author Message
erivera7
Joined: 19 Jan 2009
Posts: 185
Location: Chicago, IL
PostPosted: Wed Dec 08, 2010 12:57 pm Post subject: Reply with quote
Ah, okay. Thanks for making the data readily available for the public! Much appreciated.
_________________
@erivera7
I cover the Orlando Magic - Magic Basketball
Back to top
View user's profile Send private message
DSMok1
Joined: 05 Aug 2009
Posts: 611
Location: Where the wind comes sweeping down the plains
PostPosted: Wed Dec 15, 2010 11:31 am Post subject: Reply with quote
I'm preparing to evaluate salaries and contracts, so I'm working on long-term projections based upon the latest updated true-talent level.
Obviously not all players will age the same; some of the young guns will probably jump to transcendant status like CP3, Lebron, and D-Wade start out. We just don't know who, yet!
Here's the pretty picture:
Those are the top 25 projected players in the 2015-2016 season.
Note some of the rookies from this year moving up! Also note OKC's roster--3 players present.
_________________
GodismyJudgeOK.com/DStats
Twitter.com/DSMok1
Back to top
View user's profile Send private message Send e-mail Visit poster's website
DSMok1
Joined: 05 Aug 2009
Posts: 611
Location: Where the wind comes sweeping down the plains
PostPosted: Mon Dec 20, 2010 7:32 pm Post subject: Reply with quote
Updated Spreadsheet: https://docs.google.com/leaf?id=0Bx1NfC ... MzRl&hl=en
_________________
GodismyJudgeOK.com/DStats
Twitter.com/DSMok1
Back to top
View user's profile Send private message Send e-mail Visit poster's website
EvanZ
Joined: 22 Nov 2010
Posts: 295
PostPosted: Mon Dec 20, 2010 9:13 pm Post subject: Reply with quote
DSMok1 wrote:
Obviously not all players will age the same; some of the young guns will probably jump to transcendant status like CP3, Lebron, and D-Wade start out. We just don't know who, yet!
I hope CP3 is around in 5 years, but his knees may be mush by then.
_________________
http://www.thecity2.com
http://www.ibb.gatech.edu/evan-zamir
Back to top
View user's profile Send private message
DSMok1
Joined: 05 Aug 2009
Posts: 611
Location: Where the wind comes sweeping down the plains
PostPosted: Mon Dec 20, 2010 9:22 pm Post subject: Reply with quote
EvanZ wrote:
DSMok1 wrote:
Obviously not all players will age the same; some of the young guns will probably jump to transcendant status like CP3, Lebron, and D-Wade start out. We just don't know who, yet!
I hope CP3 is around in 5 years, but his knees may be mush by then.
Yeah. I'd expect outliers like him to age more rapidly.
_________________
GodismyJudgeOK.com/DStats
Twitter.com/DSMok1