Calc value high usage inefficient scorers? Italian Stallion
Posted: Mon Apr 18, 2011 4:59 am
Author Message
Italian Stallion
Joined: 04 Mar 2009
Posts: 112
PostPosted: Thu Jul 15, 2010 9:28 am Post subject: Calculating the value of high usage inefficient scorers? Reply with quote
We've all seen examples of high usage scorers whose TS% is at or below the league average of (54%-55%). In fact quite a few top NBA scorers fall into that category.
If a high usage player's TS% is only average, how much value is he actually adding by taking a lot of extra shots and scoring a lot more points?
It seems to me that in most cases most of those those shots could easily be taken by other players on the team with similar results.
So little or no value is added.
If a high usage player's TS% is below average, how much value is he adding or actually destroying by taking a lot of extra shots and scoring a lot more points?
It seems to me he is destroying value.
I suppose it's possible that by taking some extra shots, a player's teammates might get to be more selective and "might" increase their own efficiency mildly. But intuitively it seems to me that the majority of value a scorer adds comes from contributing the first 15 or so points at average TS% or better so he doesn't weaken the overall offense and all the remaining value only comes from scoring at above average TS%. Any time you are scoring at below average efficiency you weaken the team (unless of course your teammates are even worse).
Back to top
View user's profile Send private message
BobboFitos
Joined: 21 Feb 2009
Posts: 201
Location: Cambridge, MA
PostPosted: Thu Jul 15, 2010 10:48 am Post subject: Reply with quote
Quote:
It seems to me that in most cases most of those those shots could easily be taken by other players on the team with similar results.
this is where you're mistaken. that pretty much is the root of it.
_________________
http://pointsperpossession.com/
@PPPBasketball
Back to top
View user's profile Send private message
DSMok1
Joined: 05 Aug 2009
Posts: 611
Location: Where the wind comes sweeping down the plains
PostPosted: Thu Jul 15, 2010 12:39 pm Post subject: Re: Calculating the value of high usage inefficient scorers? Reply with quote
Italian Stallion wrote:
We've all seen examples of high usage scorers whose TS% is at or below the league average of (54%-55%). In fact quite a few top NBA scorers fall into that category.
If a high usage player's TS% is only average, how much value is he actually adding by taking a lot of extra shots and scoring a lot more points?
It seems to me that in most cases most of those those shots could easily be taken by other players on the team with similar results.
So little or no value is added.
If a high usage player's TS% is below average, how much value is he adding or actually destroying by taking a lot of extra shots and scoring a lot more points?
It seems to me he is destroying value.
I suppose it's possible that by taking some extra shots, a player's teammates might get to be more selective and "might" increase their own efficiency mildly. But intuitively it seems to me that the majority of value a scorer adds comes from contributing the first 15 or so points at average TS% or better so he doesn't weaken the overall offense and all the remaining value only comes from scoring at above average TS%. Any time you are scoring at below average efficiency you weaken the team (unless of course your teammates are even worse).
I just ran a regression on this as part of my new Advanced SPM. Some samples of players near 0 in offensive worth, including assists and turnovers: Dwight Howard, Josh Smith, Gerald Wallace, Zach Randolph, Andrew Bogut, Lamar Odom, Rudy Gay, Jeff Green, Al Jefferson.
Players with TS% below 54% that have above +2 offense: Joe Johnson, Tyreke Evans, Russel Westbrook, Derrick Rose. Basically lots of assists or, in Joe Johnson's case, very few turnovers.
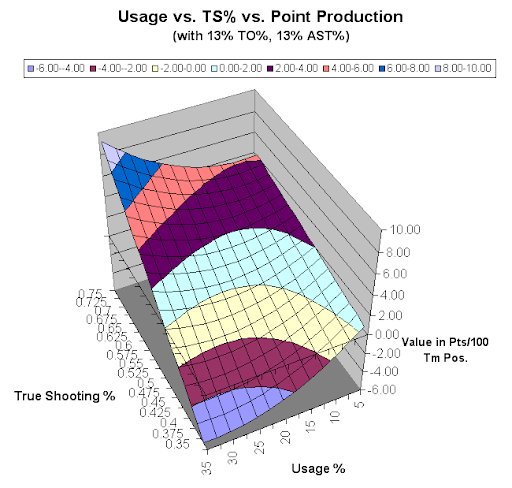
Basically, it varies. It depends on the turnover percentage, the assist percentage, and both true shooting and usage rates.
Here's a chart using league-average turnover% and league-average AST rate:
Back to top
View user's profile Send private message Send e-mail Visit poster's website
Italian Stallion
Joined: 04 Mar 2009
Posts: 112
PostPosted: Thu Jul 15, 2010 8:35 pm Post subject: Reply with quote
BobboFitos wrote:
Quote:
It seems to me that in most cases most of those those shots could easily be taken by other players on the team with similar results.
this is where you're mistaken. that pretty much is the root of it.
I understand that there may be some relationship between usage and efficiency, but let's take an example.
Player "X" has a TS% of 52% and takes close to 20 shots per night. That would make him a high scorer with slightly below average efficiency.
At any give time he's on the court with other 4 players.
1 has above average efficiency, 2 are average, and 1 is similar to him (net of average but better than him).
I find it hard to believe that player "X" couldn't reduce his total shot count by 2-4 shot per night, distribute them between the other players, and produce a better value for the team.
Back to top
View user's profile Send private message
DSMok1
Joined: 05 Aug 2009
Posts: 611
Location: Where the wind comes sweeping down the plains
PostPosted: Thu Jul 15, 2010 9:52 pm Post subject: Reply with quote
I believe this is a "Nash Equilibrium"/ game theory problem? If each player had linear usage vs. efficiency curves, then the optimum would have every player with the same TS%. The problem is that they aren't linear. You can construct parabolic skill curves for each player and then use Excel's solver to predict the best usage pattern for that team.... Only we don't know the skill curves.
Back to top
View user's profile Send private message Send e-mail Visit poster's website
bchaikin
Joined: 27 Jan 2005
Posts: 690
Location: cleveland, ohio
PostPosted: Thu Jul 15, 2010 10:56 pm Post subject: Reply with quote
If a high usage player's TS% is only average, how much value is he actually adding by taking a lot of extra shots and scoring a lot more points? It seems to me that in most cases most of those those shots could easily be taken by other players on the team with similar results. So little or no value is added. If a high usage player's TS% is below average, how much value is he adding or actually destroying by taking a lot of extra shots and scoring a lot more points? It seems to me he is destroying value.
this is where you're mistaken. that pretty much is the root of it.
in cases where a really high scorer shoots overall worse than the league average, i certainly agree with the first statement...
for example, from 01-02 to 03-04 allen iverson scored 28.5 pts/g playing 43 min/g (2nd best scoring in the league during that time). he shot just a 48.1 ScFG% (43% on 2s, 28% on 3s - 250+ 3pt FGAs/yr - 78% on FTs) when the league average ScFG% was 51.1%, or 3% better. the rest of the 76ers shot a 50.9% ScFG% these 3 seasons, close to the league average...
the worst shooting team during this 3 year stretch was denver at a 48.6% ScFG% (the best dallas at a 53.6% ScFG%). so iverson all by his lonesome self shot worse than what every other single team did...
i'd like to hear the logic for why the rest of the 76ers would shoot worse as a team than what iverson shot (had he not played) when he himself shot worse than every other team, should anyone believe so...
in 05-06 the 76ers outside of iverson (who lead the team in scoring with 33 pts/g and minutes played with 3103) shot a 52.7% ScFG%. in 06-07 he was traded to denver (after 15 games and just 640 minutes) and the 76ers without him shot a 52.3% ScFG%...
in 07-08 denver outside of iverson (who lead the team in scoring with 26.4 pts/g and in minutes played with 3424) shot a 54.5% ScFG%. in 08-09 he was traded after 3 games and 123 minutes played, yet the nuggets shot a 55.2% ScFG%...
any idea that iverson shot the ball a ton simply because his teammates wouldn't or couldn't is nonsense...
iverson was the ages of 26-28 from 01-02 to 03-04 (looking at b-days as of 11/1). looking at all players since 1977-78 ages 26-28 that averaged 20+ pts/g and that played at least 3000 total minutes (a total of 78 different players) over the 3 years, iverson had - by far - the lowest/worst overall shooting...
as a matter of fact just the average ScFG% of these 78 players was a 55.0% ScFG%. so iverson shot almost 7% less than just the average of this group of high scorers at a similar age. you have to go back all the way to the early 1970s to find a player (elvin hayes) who shot worse overall from the ages of 26-28 while scoring 20+ pts/g and playing 3000+ minutes...
Back to top
View user's profile Send private message Send e-mail Visit poster's website
Kevin Pelton
Site Admin
Joined: 30 Dec 2004
Posts: 979
Location: Seattle
PostPosted: Fri Jul 16, 2010 10:28 am Post subject: Reply with quote
DSMok1 wrote:
Only we don't know the skill curves.
Further, everything we do know about them suggests that they are much flatter for star players than for role players. It's perfectly reasonable to concoct a model that shows very different average True Shooting Percentages but identical marginal True Shooting Percentages for the scenario described above. And the latter is what is really relevant to the question of whether a player should shoot less.
Back to top
View user's profile Send private message Send e-mail Visit poster's website
Italian Stallion
Joined: 04 Mar 2009
Posts: 112
PostPosted: Fri Jul 16, 2010 10:41 pm Post subject: Reply with quote
Kevin Pelton wrote:
DSMok1 wrote:
Only we don't know the skill curves.
Further, everything we do know about them suggests that they are much flatter for star players than for role players. It's perfectly reasonable to concoct a model that shows very different average True Shooting Percentages but identical marginal True Shooting Percentages for the scenario described above. And the latter is what is really relevant to the question of whether a player should shoot less.
Does anyone think the Nuggets and Lakers wouldn't be better off if Melo and Kobe didn't shoot as much given that both teams have a few much higher efficiency options available?
I'm not sure how many extra shots you could get for those players and keep the efficiency on the incremental shots higher than Kobe/Melo, but the gap in efficiency is so large it almost has to be a few.
Back to top
View user's profile Send private message
DSMok1
Joined: 05 Aug 2009
Posts: 611
Location: Where the wind comes sweeping down the plains
PostPosted: Sat Jul 17, 2010 7:54 am Post subject: Reply with quote
Italian Stallion wrote:
Kevin Pelton wrote:
DSMok1 wrote:
Only we don't know the skill curves.
Further, everything we do know about them suggests that they are much flatter for star players than for role players. It's perfectly reasonable to concoct a model that shows very different average True Shooting Percentages but identical marginal True Shooting Percentages for the scenario described above. And the latter is what is really relevant to the question of whether a player should shoot less.
Does anyone think the Nuggets and Lakers wouldn't be better off if Melo and Kobe didn't shoot as much given that both teams have a few much higher efficiency options available?
I'm not sure how many extra shots you could get for those players and keep the efficiency on the incremental shots higher than Kobe/Melo, but the gap in efficiency is so large it almost has to be a few.
Here's the deal. Melo and Kobe take a lot of "unassisted" shots. If a shot is assisted, its TS% is somewhere around 7% higher, not to mention a lot of close shots wouldn't even happen without an assist. If, say, Chris Anderson was going to increase his number of shots, well, he can't without jacking bad shots. His shots are nearly all assisted. I would hazard that his "unassisted" shots are much, much lower TS%. I calculated once what an assist contributed. Most of the value of a shot at the rim has to do with the passer, not the shooter, because the shooter would not get the shot without the passer.
In fact, in another SPM regression I was experimenting with using shot location and assisted%. Basically, a player like Chris Anderson who shoots a very high TS% but most shots are assisted really isn't the one to credit at all. He can't take more shots unless someone assists him. He has the high TS% purely because of Billups and, to a lesser extent, Melo.
Incidentally, that was the only regression that could explain the high APM split between Nash and Amare. Amare's high TS% is mostly attributable to Nash's ridiculous number of assists to "At Rim".
_________________
GodismyJudgeOK.com/DStats
Twitter.com/DSMok1
Back to top
View user's profile Send private message Send e-mail Visit poster's website
Italian Stallion
Joined: 04 Mar 2009
Posts: 112
PostPosted: Sun Jul 18, 2010 11:06 am Post subject: Reply with quote
DSMok1 wrote:
Italian Stallion wrote:
Kevin Pelton wrote:
DSMok1 wrote:
Only we don't know the skill curves.
Further, everything we do know about them suggests that they are much flatter for star players than for role players. It's perfectly reasonable to concoct a model that shows very different average True Shooting Percentages but identical marginal True Shooting Percentages for the scenario described above. And the latter is what is really relevant to the question of whether a player should shoot less.
Does anyone think the Nuggets and Lakers wouldn't be better off if Melo and Kobe didn't shoot as much given that both teams have a few much higher efficiency options available?
I'm not sure how many extra shots you could get for those players and keep the efficiency on the incremental shots higher than Kobe/Melo, but the gap in efficiency is so large it almost has to be a few.
Here's the deal. Melo and Kobe take a lot of "unassisted" shots. If a shot is assisted, its TS% is somewhere around 7% higher, not to mention a lot of close shots wouldn't even happen without an assist. If, say, Chris Anderson was going to increase his number of shots, well, he can't without jacking bad shots. His shots are nearly all assisted. I would hazard that his "unassisted" shots are much, much lower TS%. I calculated once what an assist contributed. Most of the value of a shot at the rim has to do with the passer, not the shooter, because the shooter would not get the shot without the passer.
In fact, in another SPM regression I was experimenting with using shot location and assisted%. Basically, a player like Chris Anderson who shoots a very high TS% but most shots are assisted really isn't the one to credit at all. He can't take more shots unless someone assists him. He has the high TS% purely because of Billups and, to a lesser extent, Melo.
Incidentally, that was the only regression that could explain the high APM split between Nash and Amare. Amare's high TS% is mostly attributable to Nash's ridiculous number of assists to "At Rim".
I don't disagree with anything you are saying, but IMO if both Melo and Kobe looked to pass more often instead of jacking up the occasional idiotic shot, their TS% would probably rise and the team would be more productive because both have high TS% alternatives to get the ball to and both have enough passing skills to accomplish the task.
Back to top
View user's profile Send private message
thref23
Joined: 13 Aug 2007
Posts: 90
PostPosted: Sun Jul 18, 2010 5:44 pm Post subject: Reply with quote
Not in disagreement with discussion thus far, I think it's vital to compare a player's efficiency with that of his teammates on the floor with him...usage (or the equivalent) + efficiency should invite defensive attention, invited defensive attention should improve teammates' efficiency, shot selection should maximize distributory effects (and plus/minus stats should help with analysis of such effects).
From a conceptual standpoint I think this is interesting:
http://sloansportsconference.com/upload ... etball.pdf
Back to top
View user's profile Send private message Send e-mail
Italian Stallion
Joined: 04 Mar 2009
Posts: 112
PostPosted: Mon Jul 19, 2010 1:41 pm Post subject: Reply with quote
DSMok1,
I am really looking forward to seeing how Amare does with the Knicks. I think he's a pretty good test case for the value of Nash and whether his box score numbers or his +/- numbers are telling a more accurate story about his contribution.
Back to top
View user's profile Send private message
gabefarkas
Joined: 31 Dec 2004
Posts: 1313
Location: Durham, NC
PostPosted: Tue Jul 20, 2010 7:29 am Post subject: Reply with quote
bchaikin wrote:
for example, from 01-02 to 03-04 allen iverson scored 28.5 pts/g playing 43 min/g (2nd best scoring in the league during that time). he shot just a 48.1 ScFG% (43% on 2s, 28% on 3s - 250+ 3pt FGAs/yr - 78% on FTs) when the league average ScFG% was 51.1%, or 3% better. the rest of the 76ers shot a 50.9% ScFG% these 3 seasons, close to the league average...
Bob - can you remind me how ScFG% is calculated?
Back to top
View user's profile Send private message Send e-mail AIM Address
Prash
Joined: 30 Jul 2010
Posts: 1
Location: California
PostPosted: Sat Jul 31, 2010 12:07 pm Post subject: Reply with quote
Just wanted to chime in here on the TS% vs usage rate and the difference between role players and star players
let's assume we are talking about the Lakers and we suspect that if Kobe reduces his usage rate his TS% will go up
Then you would distribute this 'extra' usage rate that Kobe just sacrificed to the players on the court who had the highest marginal TS% gains with increases in usage rate (most likely Gasol/Bynum)
I am just wondering if it is possible to really know the marginal TS% gains ahead of time?
The reason I am skeptical is that defenses play the Lakers a certain way - they expect Kobe to have a certain usage rate. Once his usage rate changes wouldn't defenses adapt to these changes eventually?
And once defenses do adapt wouldn't this affect the marginal TS% gains of all other Lakers on the court because the defense now pays more attention to them since Kobe has a lower usage rate?
Back to top
View user's profile Send private message
Crow
Joined: 20 Jan 2009
Posts: 825
PostPosted: Mon Aug 02, 2010 2:51 am Post subject: Reply with quote
By DSMok1's method and chart, it appears to me that a player with usage of 25% and a TS% of about 51% (and 1 to 1 assist% / turnover%) is about neutral and if he can raise either of these parts he becomes positive on offensive SPM because of the "scoring term".
And for the usage band between 20-25% (and still assuming 1 to 1 assist% / turnover%) the TS% needed to break into positive territory is pretty flat and about that same 51% TS%.
At 27.5% usage the TS% threshold for positive offensive SPM impact from the scoring term is right at 50% TS% and at 30% usage it is slightly below 50% TS%.
Looking at players who played over 2000 minutes last season with usage at or above 25% I see 26 of 30 over 51% TS%. I didn't stop to check the Assist % vs TO% for all but I do quickly see just 7 with less than an raw count A/TO ratio of 1 but only 2-3 significantly lower.
Limit to those at or above 27.5% usage and all 10 are over 50% TS% safely and are all near or above 52% TS%. 2 have less than a raw count A/TO of 1 (Durant and Bosh) but not that badly.
Lower the usage to 20% and there 74 qualifiers of which 66 are over 51% TS%. 18 less than a raw count A/TO of 1 but not many badly, depending on where it becomes significantly bad.
Based on these findings and my current understanding of them, it appears that the source of any negative impact for the offensive or overall SPM of big minute, over 20% usage players who have one is usually not these parts of their "scoring term" but rather the other parts of the scoring term or non-scoring related elements.
How different is the chart and positive breakpoint if the A%/TO% is less or more than 1? A chart of the break-even points for usage levels of 15, 20, 25% across these various ratios would be helpful to see.
If the impact of changes in Assist% is not static and equivalent to equal unit changes in Turnover% at other levels besides 13% on each as I assumed above, how does "the break-even impact ratio" of them change across the distributions for Assist% and Turnover%? Just how important is this ratio in shifting the TS% break-even threshold for the scoring term of lead play or pass makers vs non-elevated passers?
For a) the most recent previous version of overall SPM (which uses TR%) and b) the newer offensive and defensive splits (which use the respective OR% and DR%s) how often is a shortfall from league average rebounding rate for all players at all positions and levels of responsibility and opportunity the leading reason why a player with 20+% or 25+% usage has a negative overall SPM or split SPM? If it is very often I'd think that would a good reason to position or role adjust the SPM. If you don't want to do it for 5 traditional positions, maybe PG, wing, big would be enough or even perimeter-interior.
Last edited by Crow on Tue Aug 03, 2010 2:55 pm; edited 2 times in total
Back to top
View user's profile Send private message
Author Message
Scott S
Joined: 10 Feb 2008
Posts: 46
Location: East Rutherford, NJ
PostPosted: Mon Aug 02, 2010 12:58 pm Post subject: Reply with quote
I'd like to second DSMok1's point about higher usage players taking a lower percentage of assisted shots. If Chris Andersen shoots 55% on all close assisted shot and these assist type passes have an 80% chance of reaching him without creating a turnover, another player who creates all of his own shots will only need to effectively shoot 44% to be as effective an option for his team, even though the entry passing turnovers might not be Andersen's fault. I mention this in my website's most recent post and will go into this in more detail in the near future.
As a side point, in regards to skill curves, do they assume that if a player takes more shots, each additional shot created is more difficult or that if the player takes a larger role in the teams offense, all of his shots are equally more difficult? I've always assumed the former, but think a hint of the latter can be included. It seemed that the guy who gave the presentation about traffic patterns and high scorers taking too many shots at the Sloan Conference this past year assumed the second perspective (or at least some people I was conversing with after his presentation).
Back to top
View user's profile Send private message Visit poster's website
Crow
Joined: 20 Jan 2009
Posts: 816
PostPosted: Mon Aug 02, 2010 2:50 pm Post subject: Reply with quote
For the whether to pass and at least try to get Andersen an assisted shot vs just go with another player unassisted offensive efficiency choice, it would be helpful to know his actual turnover rate per pass received, when using the possession and when he doesn't (in addition to his overall turnover% per possession used). That way you would get a better estimate of the specific cost of the "look" / pass. It is probably quite a bit less than the overall turnover% per possession he actually used.
In general it would be helpful to know rough estimates for the average number of touches per possession or play and the league average turnover rate per perimeter and interior pass made / received. I looked briefly but didn't find it.
How much more risky / costly are interior passes than perimeter passes? It matters for optimization of team activity at the discrete action level. Sounds like you might be going somewhere close to this. If somebody looked at a sufficient sample of tape it might be possible to estimate by more detailed floor zone.
Last edited by Crow on Tue Aug 03, 2010 2:44 pm; edited 1 time in total
Back to top
View user's profile Send private message
Scott S
Joined: 10 Feb 2008
Posts: 46
Location: East Rutherford, NJ
PostPosted: Mon Aug 02, 2010 4:15 pm Post subject: Reply with quote
I was going to use this in my next post, but my tentative results using regression analysis to predict turnovers are as follows:
Code:
TOs/100 Poss Coefficient
astdclose 0.260
createdclose 0.203
astd2j 0.051
created2j 0.066
astd3p 0.062
created3p 0.045
3pasts 0.233
2Jasts 0.122
Closeasts 0.283
Code:
TOs/100 Poss Coefficient
AstdClose 0.322
AstdClose^2 -0.012
CreatedClose 0.245
CreatedClose^2 -0.007
Astd2J 0.032
Created2J 0.113
Created2J^2 -0.005
Astd3p 0.042
Created3p 0.059
3pAsts 0.109
2JAsts 0.112
CloseAsts 0.410
CloseAsts^1.5 -0.047
These indicate that the success rate in creating an additional assist on a close basket is between 70% and 80% in most instances. 2 point assists correspond with 90% "success rate" (this could mean the player passes the ball to a teammate in position to score a 2 point jump shot 300 times and they pass it up 100 times, make 90 shots, miss 100 shots and there is a passing turnover 10 times). Assists correlate with players who handle the ball, so some of the fluctuation in assists could be an indicator of ballhandling turnovers. I am more likely to believe the second model's indication that 3 point assists are more than 90% successful opposed to the first model's conclusion that success rates are only 81%.
Of course, you should keep in mind my study was done to determine the efficiency of a player who attempts to pass. This includes players who commits a ball-handling turnover while looking for a teammate to pass to, but not a player looking to create a close shot but throws the ball away in desperation. I don't know if passing turnovers would be more applicable or not in this situation.
Another side note, it would be helpful in terms of value if passes were tracked, or at least passes from a scoring position. If a player has a 75% chance of making a pass for a layup without turning it over and the shooter would make the shot 70% of the time, but they kick it out, that action hurts his team and he might even get credit for the assist using the best measurements I've seen at the moment.
Italian Stallion
Joined: 04 Mar 2009
Posts: 112
PostPosted: Thu Jul 15, 2010 9:28 am Post subject: Calculating the value of high usage inefficient scorers? Reply with quote
We've all seen examples of high usage scorers whose TS% is at or below the league average of (54%-55%). In fact quite a few top NBA scorers fall into that category.
If a high usage player's TS% is only average, how much value is he actually adding by taking a lot of extra shots and scoring a lot more points?
It seems to me that in most cases most of those those shots could easily be taken by other players on the team with similar results.
So little or no value is added.
If a high usage player's TS% is below average, how much value is he adding or actually destroying by taking a lot of extra shots and scoring a lot more points?
It seems to me he is destroying value.
I suppose it's possible that by taking some extra shots, a player's teammates might get to be more selective and "might" increase their own efficiency mildly. But intuitively it seems to me that the majority of value a scorer adds comes from contributing the first 15 or so points at average TS% or better so he doesn't weaken the overall offense and all the remaining value only comes from scoring at above average TS%. Any time you are scoring at below average efficiency you weaken the team (unless of course your teammates are even worse).
Back to top
View user's profile Send private message
BobboFitos
Joined: 21 Feb 2009
Posts: 201
Location: Cambridge, MA
PostPosted: Thu Jul 15, 2010 10:48 am Post subject: Reply with quote
Quote:
It seems to me that in most cases most of those those shots could easily be taken by other players on the team with similar results.
this is where you're mistaken. that pretty much is the root of it.
_________________
http://pointsperpossession.com/
@PPPBasketball
Back to top
View user's profile Send private message
DSMok1
Joined: 05 Aug 2009
Posts: 611
Location: Where the wind comes sweeping down the plains
PostPosted: Thu Jul 15, 2010 12:39 pm Post subject: Re: Calculating the value of high usage inefficient scorers? Reply with quote
Italian Stallion wrote:
We've all seen examples of high usage scorers whose TS% is at or below the league average of (54%-55%). In fact quite a few top NBA scorers fall into that category.
If a high usage player's TS% is only average, how much value is he actually adding by taking a lot of extra shots and scoring a lot more points?
It seems to me that in most cases most of those those shots could easily be taken by other players on the team with similar results.
So little or no value is added.
If a high usage player's TS% is below average, how much value is he adding or actually destroying by taking a lot of extra shots and scoring a lot more points?
It seems to me he is destroying value.
I suppose it's possible that by taking some extra shots, a player's teammates might get to be more selective and "might" increase their own efficiency mildly. But intuitively it seems to me that the majority of value a scorer adds comes from contributing the first 15 or so points at average TS% or better so he doesn't weaken the overall offense and all the remaining value only comes from scoring at above average TS%. Any time you are scoring at below average efficiency you weaken the team (unless of course your teammates are even worse).
I just ran a regression on this as part of my new Advanced SPM. Some samples of players near 0 in offensive worth, including assists and turnovers: Dwight Howard, Josh Smith, Gerald Wallace, Zach Randolph, Andrew Bogut, Lamar Odom, Rudy Gay, Jeff Green, Al Jefferson.
Players with TS% below 54% that have above +2 offense: Joe Johnson, Tyreke Evans, Russel Westbrook, Derrick Rose. Basically lots of assists or, in Joe Johnson's case, very few turnovers.
Basically, it varies. It depends on the turnover percentage, the assist percentage, and both true shooting and usage rates.
Here's a chart using league-average turnover% and league-average AST rate:
Back to top
View user's profile Send private message Send e-mail Visit poster's website
Italian Stallion
Joined: 04 Mar 2009
Posts: 112
PostPosted: Thu Jul 15, 2010 8:35 pm Post subject: Reply with quote
BobboFitos wrote:
Quote:
It seems to me that in most cases most of those those shots could easily be taken by other players on the team with similar results.
this is where you're mistaken. that pretty much is the root of it.
I understand that there may be some relationship between usage and efficiency, but let's take an example.
Player "X" has a TS% of 52% and takes close to 20 shots per night. That would make him a high scorer with slightly below average efficiency.
At any give time he's on the court with other 4 players.
1 has above average efficiency, 2 are average, and 1 is similar to him (net of average but better than him).
I find it hard to believe that player "X" couldn't reduce his total shot count by 2-4 shot per night, distribute them between the other players, and produce a better value for the team.
Back to top
View user's profile Send private message
DSMok1
Joined: 05 Aug 2009
Posts: 611
Location: Where the wind comes sweeping down the plains
PostPosted: Thu Jul 15, 2010 9:52 pm Post subject: Reply with quote
I believe this is a "Nash Equilibrium"/ game theory problem? If each player had linear usage vs. efficiency curves, then the optimum would have every player with the same TS%. The problem is that they aren't linear. You can construct parabolic skill curves for each player and then use Excel's solver to predict the best usage pattern for that team.... Only we don't know the skill curves.
Back to top
View user's profile Send private message Send e-mail Visit poster's website
bchaikin
Joined: 27 Jan 2005
Posts: 690
Location: cleveland, ohio
PostPosted: Thu Jul 15, 2010 10:56 pm Post subject: Reply with quote
If a high usage player's TS% is only average, how much value is he actually adding by taking a lot of extra shots and scoring a lot more points? It seems to me that in most cases most of those those shots could easily be taken by other players on the team with similar results. So little or no value is added. If a high usage player's TS% is below average, how much value is he adding or actually destroying by taking a lot of extra shots and scoring a lot more points? It seems to me he is destroying value.
this is where you're mistaken. that pretty much is the root of it.
in cases where a really high scorer shoots overall worse than the league average, i certainly agree with the first statement...
for example, from 01-02 to 03-04 allen iverson scored 28.5 pts/g playing 43 min/g (2nd best scoring in the league during that time). he shot just a 48.1 ScFG% (43% on 2s, 28% on 3s - 250+ 3pt FGAs/yr - 78% on FTs) when the league average ScFG% was 51.1%, or 3% better. the rest of the 76ers shot a 50.9% ScFG% these 3 seasons, close to the league average...
the worst shooting team during this 3 year stretch was denver at a 48.6% ScFG% (the best dallas at a 53.6% ScFG%). so iverson all by his lonesome self shot worse than what every other single team did...
i'd like to hear the logic for why the rest of the 76ers would shoot worse as a team than what iverson shot (had he not played) when he himself shot worse than every other team, should anyone believe so...
in 05-06 the 76ers outside of iverson (who lead the team in scoring with 33 pts/g and minutes played with 3103) shot a 52.7% ScFG%. in 06-07 he was traded to denver (after 15 games and just 640 minutes) and the 76ers without him shot a 52.3% ScFG%...
in 07-08 denver outside of iverson (who lead the team in scoring with 26.4 pts/g and in minutes played with 3424) shot a 54.5% ScFG%. in 08-09 he was traded after 3 games and 123 minutes played, yet the nuggets shot a 55.2% ScFG%...
any idea that iverson shot the ball a ton simply because his teammates wouldn't or couldn't is nonsense...
iverson was the ages of 26-28 from 01-02 to 03-04 (looking at b-days as of 11/1). looking at all players since 1977-78 ages 26-28 that averaged 20+ pts/g and that played at least 3000 total minutes (a total of 78 different players) over the 3 years, iverson had - by far - the lowest/worst overall shooting...
as a matter of fact just the average ScFG% of these 78 players was a 55.0% ScFG%. so iverson shot almost 7% less than just the average of this group of high scorers at a similar age. you have to go back all the way to the early 1970s to find a player (elvin hayes) who shot worse overall from the ages of 26-28 while scoring 20+ pts/g and playing 3000+ minutes...
Back to top
View user's profile Send private message Send e-mail Visit poster's website
Kevin Pelton
Site Admin
Joined: 30 Dec 2004
Posts: 979
Location: Seattle
PostPosted: Fri Jul 16, 2010 10:28 am Post subject: Reply with quote
DSMok1 wrote:
Only we don't know the skill curves.
Further, everything we do know about them suggests that they are much flatter for star players than for role players. It's perfectly reasonable to concoct a model that shows very different average True Shooting Percentages but identical marginal True Shooting Percentages for the scenario described above. And the latter is what is really relevant to the question of whether a player should shoot less.
Back to top
View user's profile Send private message Send e-mail Visit poster's website
Italian Stallion
Joined: 04 Mar 2009
Posts: 112
PostPosted: Fri Jul 16, 2010 10:41 pm Post subject: Reply with quote
Kevin Pelton wrote:
DSMok1 wrote:
Only we don't know the skill curves.
Further, everything we do know about them suggests that they are much flatter for star players than for role players. It's perfectly reasonable to concoct a model that shows very different average True Shooting Percentages but identical marginal True Shooting Percentages for the scenario described above. And the latter is what is really relevant to the question of whether a player should shoot less.
Does anyone think the Nuggets and Lakers wouldn't be better off if Melo and Kobe didn't shoot as much given that both teams have a few much higher efficiency options available?
I'm not sure how many extra shots you could get for those players and keep the efficiency on the incremental shots higher than Kobe/Melo, but the gap in efficiency is so large it almost has to be a few.
Back to top
View user's profile Send private message
DSMok1
Joined: 05 Aug 2009
Posts: 611
Location: Where the wind comes sweeping down the plains
PostPosted: Sat Jul 17, 2010 7:54 am Post subject: Reply with quote
Italian Stallion wrote:
Kevin Pelton wrote:
DSMok1 wrote:
Only we don't know the skill curves.
Further, everything we do know about them suggests that they are much flatter for star players than for role players. It's perfectly reasonable to concoct a model that shows very different average True Shooting Percentages but identical marginal True Shooting Percentages for the scenario described above. And the latter is what is really relevant to the question of whether a player should shoot less.
Does anyone think the Nuggets and Lakers wouldn't be better off if Melo and Kobe didn't shoot as much given that both teams have a few much higher efficiency options available?
I'm not sure how many extra shots you could get for those players and keep the efficiency on the incremental shots higher than Kobe/Melo, but the gap in efficiency is so large it almost has to be a few.
Here's the deal. Melo and Kobe take a lot of "unassisted" shots. If a shot is assisted, its TS% is somewhere around 7% higher, not to mention a lot of close shots wouldn't even happen without an assist. If, say, Chris Anderson was going to increase his number of shots, well, he can't without jacking bad shots. His shots are nearly all assisted. I would hazard that his "unassisted" shots are much, much lower TS%. I calculated once what an assist contributed. Most of the value of a shot at the rim has to do with the passer, not the shooter, because the shooter would not get the shot without the passer.
In fact, in another SPM regression I was experimenting with using shot location and assisted%. Basically, a player like Chris Anderson who shoots a very high TS% but most shots are assisted really isn't the one to credit at all. He can't take more shots unless someone assists him. He has the high TS% purely because of Billups and, to a lesser extent, Melo.
Incidentally, that was the only regression that could explain the high APM split between Nash and Amare. Amare's high TS% is mostly attributable to Nash's ridiculous number of assists to "At Rim".
_________________
GodismyJudgeOK.com/DStats
Twitter.com/DSMok1
Back to top
View user's profile Send private message Send e-mail Visit poster's website
Italian Stallion
Joined: 04 Mar 2009
Posts: 112
PostPosted: Sun Jul 18, 2010 11:06 am Post subject: Reply with quote
DSMok1 wrote:
Italian Stallion wrote:
Kevin Pelton wrote:
DSMok1 wrote:
Only we don't know the skill curves.
Further, everything we do know about them suggests that they are much flatter for star players than for role players. It's perfectly reasonable to concoct a model that shows very different average True Shooting Percentages but identical marginal True Shooting Percentages for the scenario described above. And the latter is what is really relevant to the question of whether a player should shoot less.
Does anyone think the Nuggets and Lakers wouldn't be better off if Melo and Kobe didn't shoot as much given that both teams have a few much higher efficiency options available?
I'm not sure how many extra shots you could get for those players and keep the efficiency on the incremental shots higher than Kobe/Melo, but the gap in efficiency is so large it almost has to be a few.
Here's the deal. Melo and Kobe take a lot of "unassisted" shots. If a shot is assisted, its TS% is somewhere around 7% higher, not to mention a lot of close shots wouldn't even happen without an assist. If, say, Chris Anderson was going to increase his number of shots, well, he can't without jacking bad shots. His shots are nearly all assisted. I would hazard that his "unassisted" shots are much, much lower TS%. I calculated once what an assist contributed. Most of the value of a shot at the rim has to do with the passer, not the shooter, because the shooter would not get the shot without the passer.
In fact, in another SPM regression I was experimenting with using shot location and assisted%. Basically, a player like Chris Anderson who shoots a very high TS% but most shots are assisted really isn't the one to credit at all. He can't take more shots unless someone assists him. He has the high TS% purely because of Billups and, to a lesser extent, Melo.
Incidentally, that was the only regression that could explain the high APM split between Nash and Amare. Amare's high TS% is mostly attributable to Nash's ridiculous number of assists to "At Rim".
I don't disagree with anything you are saying, but IMO if both Melo and Kobe looked to pass more often instead of jacking up the occasional idiotic shot, their TS% would probably rise and the team would be more productive because both have high TS% alternatives to get the ball to and both have enough passing skills to accomplish the task.
Back to top
View user's profile Send private message
thref23
Joined: 13 Aug 2007
Posts: 90
PostPosted: Sun Jul 18, 2010 5:44 pm Post subject: Reply with quote
Not in disagreement with discussion thus far, I think it's vital to compare a player's efficiency with that of his teammates on the floor with him...usage (or the equivalent) + efficiency should invite defensive attention, invited defensive attention should improve teammates' efficiency, shot selection should maximize distributory effects (and plus/minus stats should help with analysis of such effects).
From a conceptual standpoint I think this is interesting:
http://sloansportsconference.com/upload ... etball.pdf
Back to top
View user's profile Send private message Send e-mail
Italian Stallion
Joined: 04 Mar 2009
Posts: 112
PostPosted: Mon Jul 19, 2010 1:41 pm Post subject: Reply with quote
DSMok1,
I am really looking forward to seeing how Amare does with the Knicks. I think he's a pretty good test case for the value of Nash and whether his box score numbers or his +/- numbers are telling a more accurate story about his contribution.
Back to top
View user's profile Send private message
gabefarkas
Joined: 31 Dec 2004
Posts: 1313
Location: Durham, NC
PostPosted: Tue Jul 20, 2010 7:29 am Post subject: Reply with quote
bchaikin wrote:
for example, from 01-02 to 03-04 allen iverson scored 28.5 pts/g playing 43 min/g (2nd best scoring in the league during that time). he shot just a 48.1 ScFG% (43% on 2s, 28% on 3s - 250+ 3pt FGAs/yr - 78% on FTs) when the league average ScFG% was 51.1%, or 3% better. the rest of the 76ers shot a 50.9% ScFG% these 3 seasons, close to the league average...
Bob - can you remind me how ScFG% is calculated?
Back to top
View user's profile Send private message Send e-mail AIM Address
Prash
Joined: 30 Jul 2010
Posts: 1
Location: California
PostPosted: Sat Jul 31, 2010 12:07 pm Post subject: Reply with quote
Just wanted to chime in here on the TS% vs usage rate and the difference between role players and star players
let's assume we are talking about the Lakers and we suspect that if Kobe reduces his usage rate his TS% will go up
Then you would distribute this 'extra' usage rate that Kobe just sacrificed to the players on the court who had the highest marginal TS% gains with increases in usage rate (most likely Gasol/Bynum)
I am just wondering if it is possible to really know the marginal TS% gains ahead of time?
The reason I am skeptical is that defenses play the Lakers a certain way - they expect Kobe to have a certain usage rate. Once his usage rate changes wouldn't defenses adapt to these changes eventually?
And once defenses do adapt wouldn't this affect the marginal TS% gains of all other Lakers on the court because the defense now pays more attention to them since Kobe has a lower usage rate?
Back to top
View user's profile Send private message
Crow
Joined: 20 Jan 2009
Posts: 825
PostPosted: Mon Aug 02, 2010 2:51 am Post subject: Reply with quote
By DSMok1's method and chart, it appears to me that a player with usage of 25% and a TS% of about 51% (and 1 to 1 assist% / turnover%) is about neutral and if he can raise either of these parts he becomes positive on offensive SPM because of the "scoring term".
And for the usage band between 20-25% (and still assuming 1 to 1 assist% / turnover%) the TS% needed to break into positive territory is pretty flat and about that same 51% TS%.
At 27.5% usage the TS% threshold for positive offensive SPM impact from the scoring term is right at 50% TS% and at 30% usage it is slightly below 50% TS%.
Looking at players who played over 2000 minutes last season with usage at or above 25% I see 26 of 30 over 51% TS%. I didn't stop to check the Assist % vs TO% for all but I do quickly see just 7 with less than an raw count A/TO ratio of 1 but only 2-3 significantly lower.
Limit to those at or above 27.5% usage and all 10 are over 50% TS% safely and are all near or above 52% TS%. 2 have less than a raw count A/TO of 1 (Durant and Bosh) but not that badly.
Lower the usage to 20% and there 74 qualifiers of which 66 are over 51% TS%. 18 less than a raw count A/TO of 1 but not many badly, depending on where it becomes significantly bad.
Based on these findings and my current understanding of them, it appears that the source of any negative impact for the offensive or overall SPM of big minute, over 20% usage players who have one is usually not these parts of their "scoring term" but rather the other parts of the scoring term or non-scoring related elements.
How different is the chart and positive breakpoint if the A%/TO% is less or more than 1? A chart of the break-even points for usage levels of 15, 20, 25% across these various ratios would be helpful to see.
If the impact of changes in Assist% is not static and equivalent to equal unit changes in Turnover% at other levels besides 13% on each as I assumed above, how does "the break-even impact ratio" of them change across the distributions for Assist% and Turnover%? Just how important is this ratio in shifting the TS% break-even threshold for the scoring term of lead play or pass makers vs non-elevated passers?
For a) the most recent previous version of overall SPM (which uses TR%) and b) the newer offensive and defensive splits (which use the respective OR% and DR%s) how often is a shortfall from league average rebounding rate for all players at all positions and levels of responsibility and opportunity the leading reason why a player with 20+% or 25+% usage has a negative overall SPM or split SPM? If it is very often I'd think that would a good reason to position or role adjust the SPM. If you don't want to do it for 5 traditional positions, maybe PG, wing, big would be enough or even perimeter-interior.
Last edited by Crow on Tue Aug 03, 2010 2:55 pm; edited 2 times in total
Back to top
View user's profile Send private message
Author Message
Scott S
Joined: 10 Feb 2008
Posts: 46
Location: East Rutherford, NJ
PostPosted: Mon Aug 02, 2010 12:58 pm Post subject: Reply with quote
I'd like to second DSMok1's point about higher usage players taking a lower percentage of assisted shots. If Chris Andersen shoots 55% on all close assisted shot and these assist type passes have an 80% chance of reaching him without creating a turnover, another player who creates all of his own shots will only need to effectively shoot 44% to be as effective an option for his team, even though the entry passing turnovers might not be Andersen's fault. I mention this in my website's most recent post and will go into this in more detail in the near future.
As a side point, in regards to skill curves, do they assume that if a player takes more shots, each additional shot created is more difficult or that if the player takes a larger role in the teams offense, all of his shots are equally more difficult? I've always assumed the former, but think a hint of the latter can be included. It seemed that the guy who gave the presentation about traffic patterns and high scorers taking too many shots at the Sloan Conference this past year assumed the second perspective (or at least some people I was conversing with after his presentation).
Back to top
View user's profile Send private message Visit poster's website
Crow
Joined: 20 Jan 2009
Posts: 816
PostPosted: Mon Aug 02, 2010 2:50 pm Post subject: Reply with quote
For the whether to pass and at least try to get Andersen an assisted shot vs just go with another player unassisted offensive efficiency choice, it would be helpful to know his actual turnover rate per pass received, when using the possession and when he doesn't (in addition to his overall turnover% per possession used). That way you would get a better estimate of the specific cost of the "look" / pass. It is probably quite a bit less than the overall turnover% per possession he actually used.
In general it would be helpful to know rough estimates for the average number of touches per possession or play and the league average turnover rate per perimeter and interior pass made / received. I looked briefly but didn't find it.
How much more risky / costly are interior passes than perimeter passes? It matters for optimization of team activity at the discrete action level. Sounds like you might be going somewhere close to this. If somebody looked at a sufficient sample of tape it might be possible to estimate by more detailed floor zone.
Last edited by Crow on Tue Aug 03, 2010 2:44 pm; edited 1 time in total
Back to top
View user's profile Send private message
Scott S
Joined: 10 Feb 2008
Posts: 46
Location: East Rutherford, NJ
PostPosted: Mon Aug 02, 2010 4:15 pm Post subject: Reply with quote
I was going to use this in my next post, but my tentative results using regression analysis to predict turnovers are as follows:
Code:
TOs/100 Poss Coefficient
astdclose 0.260
createdclose 0.203
astd2j 0.051
created2j 0.066
astd3p 0.062
created3p 0.045
3pasts 0.233
2Jasts 0.122
Closeasts 0.283
Code:
TOs/100 Poss Coefficient
AstdClose 0.322
AstdClose^2 -0.012
CreatedClose 0.245
CreatedClose^2 -0.007
Astd2J 0.032
Created2J 0.113
Created2J^2 -0.005
Astd3p 0.042
Created3p 0.059
3pAsts 0.109
2JAsts 0.112
CloseAsts 0.410
CloseAsts^1.5 -0.047
These indicate that the success rate in creating an additional assist on a close basket is between 70% and 80% in most instances. 2 point assists correspond with 90% "success rate" (this could mean the player passes the ball to a teammate in position to score a 2 point jump shot 300 times and they pass it up 100 times, make 90 shots, miss 100 shots and there is a passing turnover 10 times). Assists correlate with players who handle the ball, so some of the fluctuation in assists could be an indicator of ballhandling turnovers. I am more likely to believe the second model's indication that 3 point assists are more than 90% successful opposed to the first model's conclusion that success rates are only 81%.
Of course, you should keep in mind my study was done to determine the efficiency of a player who attempts to pass. This includes players who commits a ball-handling turnover while looking for a teammate to pass to, but not a player looking to create a close shot but throws the ball away in desperation. I don't know if passing turnovers would be more applicable or not in this situation.
Another side note, it would be helpful in terms of value if passes were tracked, or at least passes from a scoring position. If a player has a 75% chance of making a pass for a layup without turning it over and the shooter would make the shot 70% of the time, but they kick it out, that action hurts his team and he might even get credit for the assist using the best measurements I've seen at the moment.