I was wondering if someone knew/calculated the "average" Minute-per-game distribution for an NBA roster (1-12). For example,
1.) Kobe - 38mpg
2.) Pau - 35 mpg
3.) Shaq - 32 mpg
All the way down the roster. Thanks.
Also, belated thanks to JE for putting up 2014 NPI RAPM!
http://hoopdon.weebly.com/
Average NBA Minute Distributions for Roster?
Re: Average NBA Minute Distributions for Roster?
I don't get it. When were Kobe, Pau, and Shaq on the same roster?
Re: Average NBA Minute Distributions for Roster?
Just a sequence of player MPG, or should it be from best player to worst? The first should be pretty easy to calculate. The latter is much harder.HoopDon wrote:I was wondering if someone knew/calculated the "average" Minute-per-game distribution for an NBA roster (1-12). For example,
1.) Kobe - 38mpg
2.) Pau - 35 mpg
3.) Shaq - 32 mpg
All the way down the roster. Thanks.
Also, belated thanks to JE for putting up 2014 NPI RAPM!
http://hoopdon.weebly.com/
Re: Average NBA Minute Distributions for Roster?
Do you mean something like this? http://arturogalletti.wordpress.com/201 ... -playoffs/
Re: Average NBA Minute Distributions for Roster?
xkonk,
Yes, that's pretty much what I was looking for. I had such data for the last couple years, but wanted to see if someone had broken it down using decades instead of a couple seasons.
Sorry to everyone else for my poor example (not trying to imply Kobe/Pau/Shaq on the same team), and generally murky wording. Thanks.
http://hoopdon.weebly.com/
Re: Average NBA Minute Distributions for Roster?
Anybody have or want to do the kind of reporting discussed above for the top 4 teams this year in a metric besides wins produced? I'd be interested in seeing how these teams differ in win productivity as they go from 6th man to 8th and 10th.
Re: Average NBA Minute Distributions for Roster?
For this year's playoffs, cumulative fraction (by players 1 thru x) of minutes and eWins; players ranked by playoff minutes.
In regular seasons, the better teams tend to stand pat. Weaker teams are more likely to engage in midseason trades, and for players to miss games -- thus scrambling the rankings by minute.
Top tier of tables are the 4 conference finalists.
Next tier are 2nd-round eliminees.
At right are averages for each tier.Of course, this doesn't tell us how good the Spurs were at 1 thru 8, etc -- just how their minutes and effectiveness were distributed.
In eWins per game, by minutes rank and cumulative thru that rank:
In regular seasons, the better teams tend to stand pat. Weaker teams are more likely to engage in midseason trades, and for players to miss games -- thus scrambling the rankings by minute.
Top tier of tables are the 4 conference finalists.
Next tier are 2nd-round eliminees.
At right are averages for each tier.
Code: Select all
Okl  Min   eW     SAS   Min   eW     Mia   Min   eW     Ind   Min   eW     Avg   Min   eW
1   .17   .37      1   .14   .19      1   .16   .41      1   .17   .32      1   .16   .32
2   .33   .76      2   .27   .34      2   .30   .60      2   .33   .48      2   .31   .55
3   .45   .88      3   .40   .47      3   .45   .75      3   .48   .59      3   .44   .67
4   .57   .95      4   .51   .57      4   .56   .81      4   .63   .78      4   .57   .78
5   .66   .95      5   .61   .71      5   .67   .88      5   .75   .87      5   .67   .85
6   .74   .96      6   .71   .79      6   .75   .88      6   .82   .90      6   .76   .88
7   .81   .97      7   .80   .90      7   .82   .89      7   .87   .95      7   .83   .93
8   .87   .97      8   .87   .92      8   .89   .97      8   .93   .95      8   .89   .95
9   .92   .98      9   .93   .97      9   .93   .96      9   .96   .98      9   .94   .97
10  .96   .99     10   .95   .98     10   .96   .97     10   .98   .99     10   .96   .98
11  .98  1.01     11   .97   .98     11   .99   .99     11   .99   .99     11   .98   .99
12  1.0   1.0     12   .97   .98     12   .99   .99     12   1.0   1.0     12   .99   .99
.                 13   .99   .99     13   1.0   1.0                        13   .99   1.0
.                 14   1.0   1.0

LAC  Min   eW     Por   Min   eW     Brk   Min   eW     Was   Min   eW     Avg   Min   eW
1   .15   .25      1   .17   .27      1   .16   .23      1   .17   .22      1   .17   .24
2   .30   .54      2   .34   .46      2   .31   .40      2   .33   .41      2   .32   .45
3   .45   .70      3   .50   .78      3   .44   .54      3   .48   .61      3   .47   .66
4   .58   .74      4   .66   .83      4   .55   .64      4   .63   .78      4   .60   .75
5   .69   .82      5   .80   .96      5   .64   .67      5   .75   .91      5   .72   .84
6   .79   .92      6   .87   .94      6   .73   .79      6   .82   .91      6   .80   .89
7   .87   .97      7   .90   .98      7   .81   .86      7   .87   .95      7   .86   .94
8   .92   .99      8   .94   1.0      8   .86   .89      8   .93   .97      8   .91   .96
9   .96   .99      9   .97   1.02     9   .92   .97      9   .97   .99      9   .96   .99
10  .98   .99     10   .98   1.01    10   .96   1.0     10   .99   1.0     10   .98   1.0
11  .99   .99     11   .99   1.01    11   1.0   1.0     11   .99   1.0     11   .99   1.0
12  .99   .99     12   .99   1.01    12   1.0   1.0     12   1.0   .99     12   .99   1.0
13  1.0   1.0     13   1.0   1.0                        13   1.0   1.0     13   1.0   1.0
14  1.0   1.0
In eWins per game, by minutes rank and cumulative thru that rank:
Code: Select all
Okl eW/G  sum     SAS  eW/G  sum     Mia  eW/G  sum     Ind  eW/G  sum     Avg  eW/G  sum
1   .18   .18      1   .12   .12      1   .22   .22      1   .16   .16      1   .17   .17
2   .19   .37      2   .10   .21      2   .10   .32      2   .08   .24      2   .12   .29
3   .06   .43      3   .08   .30      3   .08   .40      3   .05   .29      3   .07   .35
4   .03   .47      4   .06   .36      4   .04   .44      4   .09   .38      4   .05   .41
5   .00   .46      5   .09   .44      5   .03   .47      5   .04   .42      5   .04   .45
6   .00   .47      6   .05   .50      6   .00   .47      6   .02   .44      6   .02   .47
7   .01   .48      7   .07   .56      7   .01   .48      7   .02   .46      7   .03   .50
8   .00   .48      8   .01   .58      8   .04   .52      8   .00   .46      8   .01   .51
9   .01   .48      9   .03   .61      9   .00   .52      9   .01   .48      9   .01   .52
10  .00   .48     10   .00   .61     10   .01   .52     10   .00   .48     10   .00   .53
11  .01   .49     11   .00   .62     11   .01   .53     11   .00   .48     11   .00   .53
12  .00   .49     12   .00   .61     12   .00   .53     12   .00   .49     12   .00   .53
13  .00   .49     13   .01   .62     13   .00   .54     13   .00   .49     13   .00   .53
14  .00   .49     14   .00   .63

LAC eW/G  sum     Por  eW/G  sum     Brk  eW/G  sum     Was  eW/G  sum     Avg  eW/G  sum
1   .13   .13      1   .11   .11      1   .11   .11      1   .11   .11      1   .12   .12
2   .15   .28      2   .08   .19      2   .08   .19      2   .10   .21      2   .10   .22
3   .09   .37      3   .14   .33      3   .07   .26      3   .10   .31      3   .10   .32
4   .02   .39      4   .02   .35      4   .05   .31      4   .09   .40      4   .04   .36
5   .04   .43      5   .05   .40      5   .01   .32      5   .07   .47      5   .04   .40
6   .05   .49      6  -.01   .39      6   .06   .38      6   .00   .47      6   .03   .43
7   .03   .51      7   .02   .41      7   .03   .41      7   .02   .49      7   .02   .45
8   .01   .53      8   .01   .42      8   .01   .42      8   .01   .50      8   .01   .47
9   .00   .52      9   .01   .43      9   .04   .46      9   .01   .51      9   .01   .48
10  .00   .53     10   .00   .42     10   .01   .48     10   .00   .51     10   .00   .49
11  .00   .53     11   .00   .42     11   .00   .48     11   .00   .51     11   .00   .48
12  .00   .53     12   .00   .42     12   .00   .48     12   .00   .51     12   .00   .48
13  .00   .53     13   .00   .42                        13   .00   .51     13   .00   .49
14  .00   .53
Re: Average NBA Minute Distributions for Roster?
This viz might be helpful I just created. It shows distribution of minutes in a single game, vs. final margin, with a variety of filters
https://public.tableausoftware.com/view ... zHome=no#1
And here's a quick chart illustrating the difference between playoffs and regular season minute distribution, for a close game:
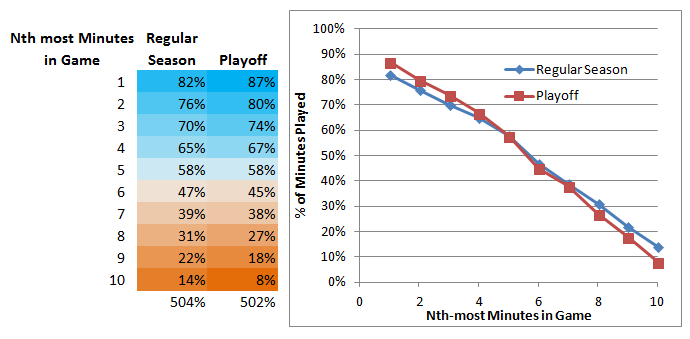
Remember, this is all for a single given game.
https://public.tableausoftware.com/view ... zHome=no#1
And here's a quick chart illustrating the difference between playoffs and regular season minute distribution, for a close game:
Remember, this is all for a single given game.
Re: Average NBA Minute Distributions for Roster?
Thanks for the new data.