Page 1 of 2
How would you measure league quality statistically?
Posted: Sun Dec 28, 2014 11:27 pm
by colts18
I downloaded dmsok's database of BPM values going back to 1978. I want to find a way to measure league quality year by year. My method would be to look at players who played 500+ minutes in back to back seasons. Then measure the difference in BPM to determine how much a league improved/declined. Probably would look at players in the prime of their careers age 24-30. Also can use this method to determine a BPM aging curve.
Re: How would you measure league quality statistically?
Posted: Sun Dec 28, 2014 11:37 pm
by Crow
League strength has been discussed before but not sure where right now.
Re: How would you measure league quality statistically?
Posted: Mon Dec 29, 2014 12:49 am
by Statman
Crow wrote:League strength has been discussed before but not sure where right now.
There's like 200 new threads to look at here - thanks Crow for throwing some interesting stuff up to look at when I find the time.
I wonder, could 1st season player quality - on average - give us an idea on the relative strength of a league? Rookies don't explode on the scene like they used to at times - I think this has a lot to do with how strong the NBA is right now & how hard it is for new & young players to adjust.
If you were going to use BPM, & since bball-ref has debut stats & BPM for every season - I would try a BPM rookie average weighted by individual minutes for every season, see if we get any kind of slight downward curve there (the league getting a little better in quality every season).
Season by season it'd be iffy - I would assume superstar rookies would spike overall rookie totals ever so often. But, I would assume we'd have a trend.
Re: How would you measure league quality statistically?
Posted: Mon Dec 29, 2014 12:55 am
by Crow
Thanks. Yeah it is a lot and may vary on quality; but I tried to have a standard on prospect of helping, some or even one researcher. And just wanted to make the reminder that the world of academic research is worth checking and not well marketed to the internet world of analysis.
Re: How would you measure league quality statistically?
Posted: Mon Dec 29, 2014 12:56 am
by Crow
The simplest way to adjust league years is just by league average efficiency.
http://www.basketball-reference.com/lea ... stats.html
Re: How would you measure league quality statistically?
Posted: Mon Dec 29, 2014 1:17 am
by colts18
Statman wrote:
Season by season it'd be iffy - I would assume superstar rookies would spike overall rookie totals ever so often. But, I would assume we'd have a trend.
Weighted average BPM for rookies

Average for players with 10+ years of experience

I don't see too many trends.
Re: How would you measure league quality statistically?
Posted: Mon Dec 29, 2014 1:36 am
by Crow
How much correlation between the two charts? Looks like a fair amount. And with a league average experience guy (is than 3-5 yrs in?)
Re: How would you measure league quality statistically?
Posted: Tue Dec 30, 2014 12:29 am
by AcrossTheCourt
No, please don't do that. A higher league efficiency can also mean the defense is worse. It says *nothing* of league quality.
The problem, obviously, is that players age and change year to year so it's difficult to figure out what effect is which.
If you have some way of testing league strength, it'd be best to check it by comparing the league before and after expansion or before and after the ABA got merged with the NBA.
The problem with looking at rookies is that in the past, they used to stay in college longer, so you're not comparing apples to apples when it's rookies in 1985 and 2015. Plus, what would it prove? That'd be like assuming rookies from every year come from a pool of the same quality, which makes no sense....
Re: How would you measure league quality statistically?
Posted: Tue Dec 30, 2014 4:23 am
by Crow
I sorta misunderstood colts18 post. He is planning on developing a method to measure league quality. Therefore he does not need my suggestion. Still it might be worth comparing what he comes up with to it. League yearly avg efficiency can change because of offense and / or defense or the rules affecting them but the efficiency is a simple objective measure of overall performance, whereas BPM is complex and involves choices that might not completely neutral yr to yr.
Re: How would you measure league quality statistically?
Posted: Tue Dec 30, 2014 5:04 pm
by DSMok1
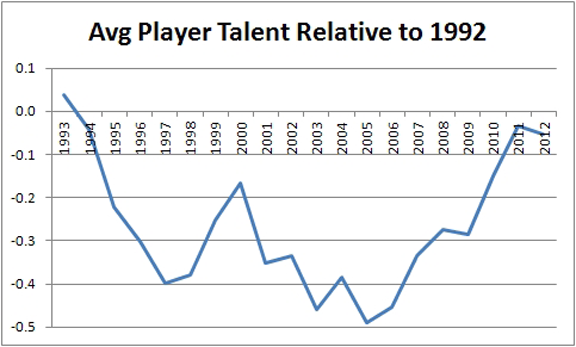
Neil Paine ran similar calculations using ASPM a couple of years ago at ESPN Insider:
http://insider.espn.go.com/olympics/bas ... t-all-time
This chart was the result:
Re: How would you measure league quality statistically?
Posted: Tue Dec 30, 2014 6:00 pm
by colts18
Here is his methodology:
How did I determine this scientifically, you ask? Borrowing a methodology from Baseball Prospectus' "Baseball Between the Numbers", I looked at all players since 1992 who played at least 1,500 minutes (per 82 scheduled games) in back-to-back seasons, then tracked how their ASPM scores were impacted by moving from one league year to the next. (In case you were wondering, I also controlled for the year-to-year effects of aging.)
The logic here is simple: If a league is more difficult one year than it was the year before, the same group of players would be expected to put up inferior ASPM numbers than those they posted the previous season.
I guess I will run something like that. I will use players who played in 1,000+ minutes in back to back seasons. How should I control for aging? I'm not exactly sure how Neil did it. Should I just look at players from age 25-29 (27 is peak age +/- 2 years)?
Re: How would you measure league quality statistically?
Posted: Wed Jan 07, 2015 9:47 pm
by gzchen
You could probably develop an aging curve. There was some discussion on this regarding J.E.'s aging curve -
viewtopic.php?f=2&t=8308. There have also been a ton of aging curve related stuff done in baseball.
Re: How would you measure league quality statistically?
Posted: Thu Jan 08, 2015 4:06 pm
by Mike G
An old thread on this matter has been lost to the Great Hacking; and I can't find my spreadsheet. But it was also posted in the 'historic' APBR forum (also hatcheted), and this much is intact:
I've made a multi-pronged stab at quantifying year-to-year NBA 'competitiveness'. I actually have great faith in the method and what it says about nearby seasons (5-10 years, say). For the long-term view, the reader is encouraged to scan the various columns for the one he may prefer.
The numbers atop the columns represent a correction (1.00 being the uncorrected version) to a 'constant of expectation'. You may read more about what went into this, here:
http://sonicscentral.com/apbrmetrics/vi ... php?t=1680
Briefly, I checked the year-to-year play of players aged 24 thru 28. These 'plateau' years don't show an overall increase or decrease in (1) minutes, or (2) rebound rate (% of available Reb.) Noticeable changes, league-wide, would seem to indicate a league that's gaining/losing strength. I've included these numbers for the curious.
The annual numbers within a column (.990 thru 1.010) should be interpreted thus: Bigger is better. Relative to the 1976-77 season (set at 1.00), a larger number indicates stronger competition in the NBA. Peaks and valleys tend to coincide across columns; the difference between the columns is in whether the NBA's competitive level peaked in 1965, in 1987, or later.
Code: Select all
    season2/season1 ratios    league strength relative to 1977: varying cumulative index

    Sea1   Min12   Reb12    Sea2   .990   .995   .998    1.00  1.002  1.005  1.010   Sea2

    1952   1.018    .976    1953   1.05    .93    .87    .82    .79    .73    .65    1953
    1953    .965   1.010    1954   1.05    .94    .87    .84    .80    .74    .66    1954
    1954    .889    .968    1955   1.12   1.01    .94    .90    .86    .81    .72    1955
    1955    .941    .945    1956   1.18   1.06   1.00    .95    .92    .86    .77    1956
    1956   1.063    .954    1957   1.16   1.05    .99    .95    .91    .86    .78    1957
    1957   1.012    .974    1958   1.16   1.05    .99    .95    .92    .87    .79    1958
    1958   1.064    .983    1959   1.12   1.02    .97    .93    .90    .85    .78    1959

    1959   1.018    .933    1960   1.14   1.04    .99    .96    .93    .88    .81    1960
    1960   1.006    .989    1961   1.13   1.04    .99    .96    .93    .89    .82    1961
    1961   1.015   1.013    1962   1.10   1.02    .98    .95    .92    .88    .82    1962
    1962    .926    .943    1963   1.17   1.09   1.04   1.01    .99    .95    .88    1963
    1963   1.025    .954    1964   1.17   1.09   1.05   1.03   1.00    .96    .90    1964
    1964    .984    .970    1965   1.18   1.11   1.07   1.05   1.02    .99    .93    1965
    1965   1.023   1.016    1966   1.15   1.09   1.05   1.03   1.01    .97    .92    1966
    1966   1.088   1.020    1967   1.08   1.03   1.00    .98    .96    .93    .88    1967
    1967   1.233    .966    1968    .98    .94    .91    .89    .88    .86    .82    1968
    1968   1.127    .983    1969    .92    .88    .86    .85    .84    .82    .79    1969

    Sea1   Min12   Reb12    Sea2   .990   .995   .998    1.00  1.002  1.005  1.010   Sea2

    1969   1.018    .995    1970    .91    .88    .86    .84    .83    .82    .79    1970
    1970   1.094    .958    1971    .88    .85    .84    .83    .82    .80    .78    1971
    1971    .936   1.030    1972    .88    .86    .85    .84    .83    .82    .80    1972
    1972    .984    .986    1973    .89    .87    .86    .85    .85    .84    .82    1973
    1973    .942   1.015    1974    .90    .89    .88    .87    .87    .86    .85    1974
    1974    .977    .959    1975    .92    .91    .91    .90    .90    .89    .88    1975
    1975    .972    .984    1976    .93    .93    .92    .92    .92    .92    .91    1976
    1976    .879    .966    1977   1.00   1.00   1.00   1.00   1.00   1.00   1.00    1977
    1977    .986    .995    1978   1.00   1.00   1.01   1.01   1.01   1.01   1.02    1978
    1978    .937   1.011    1979   1.02   1.03   1.03   1.04   1.04   1.05   1.06    1979

    1979    .945    .964    1980   1.05   1.07   1.08   1.09   1.09   1.10   1.12    1980
    1980   1.042    .970    1981   1.04   1.06   1.07   1.08   1.09   1.10   1.12    1981
    1981    .932   1.010    1982   1.06   1.09   1.10   1.11   1.13   1.14   1.17    1982
    1982    .983    .992    1983   1.06   1.09   1.11   1.13   1.14   1.16   1.20    1983
    1983    .969    .994    1984   1.07   1.11   1.13   1.15   1.17   1.19   1.23    1984
    1984    .972    .990    1985   1.08   1.13   1.15   1.17   1.19   1.22   1.27    1985
    1985    .928    .984    1986   1.12   1.17   1.20   1.23   1.25   1.28   1.34    1986
    1986   1.027    .967    1987   1.11   1.17   1.21   1.23   1.25   1.29   1.36    1987
    1987   1.015    .990    1988   1.10   1.16   1.20   1.23   1.25   1.30   1.37    1988
    1988   1.038   1.017    1989   1.06   1.12   1.17   1.19   1.22   1.27   1.35    1989

    Sea1   Min12   Reb12    Sea2   .990   .995   .998    1.00  1.002  1.005  1.010   Sea2

    1989   1.073    .992    1990   1.02   1.08   1.13   1.16   1.19   1.24   1.32    1990
    1990    .987   1.003    1991   1.01   1.09   1.13   1.16   1.20   1.25   1.34    1991
    1991   1.093    .959    1992    .98   1.05   1.10   1.14   1.17   1.23   1.32    1992
    1992   1.052    .988    1993    .95   1.03   1.08   1.12   1.15   1.21   1.31    1993
    1993    .967    .977    1994    .97   1.05   1.11   1.15   1.19   1.25   1.36    1994
    1994   1.006    .966    1995    .97   1.06   1.12   1.16   1.21   1.27   1.39    1995
    1995   1.024   1.011    1996    .94   1.04   1.10   1.14   1.19   1.26   1.38    1996
    1996    .981    .934    1997    .98   1.08   1.15   1.19   1.24   1.32   1.46    1997
    1997    .960    .996    1998    .99   1.10   1.17   1.22   1.27   1.36   1.51    1998
    1998    .964   1.080    1999    .96   1.07   1.15   1.20   1.25   1.34   1.49    1999

    1999   1.014    .976    2000    .96   1.07   1.15   1.20   1.26   1.35   1.51    2000
    2000   1.043    .982    2001    .93   1.05   1.13   1.19   1.25   1.34   1.51    2001
    2001   1.050   1.025    2002    .89   1.01   1.09   1.15   1.20   1.30   1.47    2002
    2002    .997    .954    2003    .90   1.03   1.12   1.17   1.24   1.34   1.52    2003
    2003   1.000    .967    2004    .91   1.04   1.13   1.19   1.26   1.37   1.56    2004
    2004   1.008   1.032    2005    .88   1.02   1.11   1.17   1.24   1.35   1.55    2005
    2005   1.028   1.017    2006    .86    .99   1.08   1.15   1.21   1.32   1.53    2006
    2006    .938   1.013    2007    .87   1.01   1.11   1.17   1.25   1.36   1.58    2007
For the most part, a peak or a valley is seen in the same season (or adjacent season), across columns. Here's a much-foreshortened view of those inflection points:
Code: Select all
     league-strength relative to 1977: varying cumulative index

    Sea2   .990   .995   .998    1.00  1.002  1.005  1.010   Sea2

    1953   1.05    .93    .87    .82    .79    .73    .65    1953
    1965   1.18   1.11   1.07   1.05   1.02    .99    .93    1965
    1971    .88    .85    .84    .83    .82    .80    .78    1971
    1977   1.00   1.00   1.00   1.00   1.00   1.00   1.00    1977
    1987   1.11   1.17   1.21   1.23   1.25   1.29   1.36    1987
    1993    .95   1.03   1.08   1.12   1.15   1.21   1.31    1993
    1998    .99   1.10   1.17   1.22   1.27   1.36   1.51    1998
    2002    .89   1.01   1.09   1.15   1.20   1.30   1.47    2002
    2007    .87   1.01   1.11   1.17   1.25   1.36   1.58    2007
Re: How would you measure league quality statistically?
Posted: Fri Jan 09, 2015 5:08 pm
by schtevie
Like Mike G, let me try to recall some general remarks that were offered in one or more similar threads from prehistory.
If you want to measure league quality statistically and do it persuasively (though most folks have strong priors about this topic and aren't prepared to be dislodged) there are a few very much not small issues that must be addressed and dealt with. I am thinking (at least) of the effects of:
(1) Demographics.
(2) League expansion.
(3) Yearly talent fluctuations.
(4) "Technological" change over time.
The first three can stand now without comment, but a few words about the fourth. There is a basic conceptual question of what is meant by league quality. If over time new(ish) strategies are adopted that dominate the old (and they are) then the baseline around which other factors cause fluctuations is upward sloping. But this basic truth (to my recollection) is never taken into account.
Not that one should abandon all hope (though one should) but at least be aware of not conflating estimates of these various effects.
Re: How would you measure league quality statistically?
Posted: Thu Jan 22, 2015 8:19 pm
by carrie56
colts18 wrote:Statman wrote:
Season by season it'd be iffy - I would assume superstar rookies would spike overall rookie totals ever so often. But, I would assume we'd have a trend.
Weighted average BPM for rookies
Average for players with 10+ years of experience
I don't see too many trends.
Hi,
why are your years in the graph so close to each other?