Page 1 of 1
Metrics Question Discussion
Posted: Mon Apr 06, 2015 2:58 pm
by Chris Hoffman
Hello everyone,
After witnessing the defeat of Kentucky to Wisconsin which I think everyone is suprised about; it got me thinking about in-game synergy with team-mates.
The analysis for an hour after that game consisted of many points, but the most interesting to me was this point: Wisconsin was able to find the "gaps" in the defense of Kentucky during the first half of the game as Wisoncon's scoring efficiency was low, but then in the second half of the game their scoring efficiency rose, and the reason the post game analysts including C.Barkley gave, was that Wisoncon players could find the defensive holes through the Kentucky defense that had three seven foot players.
One can admit that these holes were not big, but like pitching in baseball, if you find the batters hole in thier swing, and keep grooving that pitch, you will strike the batter out. Wisconsin found the hole in Kentucky and grooved it to win. My question is: What metrics on offense can you attribute to finding holes in a defense? My first proposal is Time to score a field goal with a point scale systems that awards more points to less time to score, kind of like in golf, where less strokes is king.
How do you account for a teams synergy?
I'll start by trying to define synergy as a teams ability of a team to adjust to a percieved pattern of past events from the opposing team. So assuming the percieved team makes no adjustment, the former team changes an execution pattern which translates to a greater offensive scoring efficiency. So is time to score the only possible metric?
Given that definition what metrics can measure this other than time of possession?
Secondary question: What statistic if any exist bring into account shot clock violation as a measure aiding into defensive efficiency?
-Thanks guys,
-Chris
Re: Metrics Question Discussion
Posted: Mon Apr 06, 2015 3:45 pm
by NateTG
After witnessing the defeat of Kentucky to Wisconsin which I think everyone is suprised about; ...
Fivethirtyeight gave them a 1 in 4 chance to lose, and Vegas had them at -5. Those aren't sky-high odds. How do we know that the Badgers didn't just have an extra lucky day? Remember, the announcers job isn't really to tell us the truth, but to entertain us.
So is time to score the only possible metric?
There are plenty of metrics. Shot location and shooter openness are probably good ones.
'Time to shoot' isn't necessarily the best indicator of offensive quality. Consider, for example, last year's 76ers who shot quickly, but poorly -
http://www.inpredictable.com/2015/04/de ... s-now.html . Inpredictable has done several posts about offensive pace that you might find interesting recently.
Re: Metrics Question Discussion
Posted: Mon Apr 06, 2015 5:40 pm
by Crow
I may or may not be on same wave length as the original poster but I can see that time to shoot / score would be useful to look at when say preceded by greater than 50-60-65% shooting on previous 5-7 shots or below average shooting too.
Could also look at shot attempts by floor location. If above or below average FG% from a specific floor location, does the team increase or decrease shot frequency from that location on average or against that specific opposing team? Could take this down to player level. What is the optimal number of times to go to a location or shooter / location vs a defense? Game theory should be applied to team shot distribution and sequencing. I have been interested in play sequencing for a long time but have not taken a big play by play database and brought smart parsing to bear on it. Someone should. Ideally you'd want video based data to characterize the defense into man / zone, big / small, fouling / reserved, focused most on inside or 3 pt line, etc.
Re: Metrics Question Discussion
Posted: Mon Apr 06, 2015 6:00 pm
by Chris Hoffman
Very insightful analysis, it seems people are way ahead of me, am still playing catchup here. That study showed inconsistent results with time per possession and offensive efficiency, it seemed like there was corellation between the two but it's not so simple, thanks for the post it's a good read I'll read it again. Basketball is so fluid.
Re: Metrics Question Discussion
Posted: Mon Apr 06, 2015 6:36 pm
by Chris Hoffman
Crow wrote:I may or may not be on same wave length as the original poster but I can see that time to shoot / score would be useful to look at when say preceded by greater than 50-60-65% shooting on previous 5-7 shots or below average shooting too.
Could also look at shot attempts by floor location. If above or below average FG% from a specific floor location, does the team increase or decrease shot frequency from that location on average or against that specific opposing team? Could take this down to player level. What is the optimal number of times to go to a location or shooter / location vs a defense? Game theory should be applied to team shot distribution and sequencing. I have been interested in play sequencing for a long time but have not taken a big play by play database and brought smart parsing to bear on it. Someone should. Ideally you'd want video based data to characterize the defense into man / zone, big / small, fouling / reserved, focused most on inside or 3 pt line, etc.
Yeah I think I see what your saying here, when is the right time to switch from a zone to man to man, or when is the right time to start taking three's, and let the analysis tell you that after x points of lead or deficit, start taking three's or start driving in the paint. You would think it would be better to let the offense set up to get around the paint for a rebound just incase the ball does not go in. It seems from the last analysis post, that time per possession as it goes down does not necssitate a greater points per possession, so it seems the best sequence if I understand you right is to let the offense set up, pass the ball around for an opening and shoot, if no opening, drive in and get a foul, since fouls are called for just about every drive, there is no reason not to drive in towards the end of the game where fouls are the name of the game. I have no data, but it seems like in the begining you let the offense set up, pass the ball around, and work strickly on the forgotten mid-range jump shot and just drain them, or that easy assist lay in. Towards the end of the game, change your sequence to driving the paint. Now I want to know how many games come down to free-throw percentage. Free-throw percentage may be the undervalued stat, am just guessing.
Re: Metrics Question Discussion
Posted: Wed Apr 08, 2015 2:11 pm
by Chris Hoffman
NateTG wrote:
After witnessing the defeat of Kentucky to Wisconsin which I think everyone is suprised about; ...
Fivethirtyeight gave them a 1 in 4 chance to lose, and Vegas had them at -5. Those aren't sky-high odds. How do we know that the Badgers didn't just have an extra lucky day? Remember, the announcers job isn't really to tell us the truth, but to entertain us.
So is time to score the only possible metric?
There are plenty of metrics. Shot location and shooter openness are probably good ones.
'Time to shoot' isn't necessarily the best indicator of offensive quality. Consider, for example, last year's 76ers who shot quickly, but poorly -
http://www.inpredictable.com/2015/04/de ... s-now.html . Inpredictable has done several posts about offensive pace that you might find interesting recently.
If Vegas had them at a low chance to win and you bet for Kentucky to win that means Vegas was very happy to see Kentucky lose because there would have been big payouts from Vegas if Kentucky went all the way. Personally I thought Notre Dame had them.
Shot location is dependant upon the player and shooter openness can be subjective. What is open for a three point shot and a drive in the paint may be valid, but what is considered open in the paint would not be considered open for a three point shot. So how do you differentiate? Time is nice because it takes the entire strategy of the offense into account, or how the coach wants his/her team to execute. The quicker the team can do that, assuming the strategy leads to points, is a positive statistic to have. If the team cannot execute the strategy, then say a shorter time of possession will be percieved as negative.
So time per field goal would be an interesting statistic, as the clock, especially when trailing, is the enemy. Time per field goal incorporates another aspect and that is team synergy. Instead of just giving the ball to the superstar and have them go at it everytime solo, I would propose that time per field goal would incorporate more of an entire team "buy In" to winning and incorporate every players positive skill set to get that FG. Teams practice set plays and time per field goal would not only show thier efficiency on offense, but show how efficient thier leadership is at designing plays. It also forces coaches to take a second look at just giving the ball to the all-star. Granted every team wants the all-star, but I think what we searching for and the spirit of what this site looks for are the undervalued players, so the question becomes what is the most valuable stat to consider? Time per field goal would be one more tool in the set of tools that can be used to value players, it would also redefine the assist and give credit or debit to all the players on the team, instead of focus on the superstar. The stats even show that the very good superstars have at least 3 assists, which means there is team synergetic buy in, and the time per field goal is a good measure of that. Sure the superstars can score 60 points a game, but how much does that build team morale and synergy and allow players to develop? I would propose that after three passes, including the inbound, time per field goal is a statistic that encompasses, 1. team synergy, 2. leadership quality, and 3. Overall team "buy in".
I am new to basketball but am trying to look at this as objective as possible, I don't understand how shot location is a good indicator of offensive capability, unless the field goal is taken into account. You can't measure shot location and relate it to a field goal as being respresented as one number, you can only have shot location represented as a percentage of success and shot location lacks the language of team synergy. For shot location to be valid to encompass team synergy, the shooter has to open and the field goal must go in. That is do-able but a stringent set of requirments. Even if you go on the assumption that the closer the shot, the higher chance the ball goes in can be challanged. Is there a relationship between shot distance and FG percentage? There are many questions that arise with shot location.
Re: Metrics Question Discussion
Posted: Wed Apr 08, 2015 3:18 pm
by NateTG
Re: Metrics Question Discussion
Posted: Wed Apr 08, 2015 6:09 pm
by Chris Hoffman
Lots of data to look at, the third link represented models that were inconsistent with the first two, either way, the data shows something interesting. As the shot distance goes down, unless the shooter is right under the basket, the shot percentage is marginally the same except when you get to the three point ranges in the corners. The data shows its better to shoot from the corner threes than it is to shoot a mid-range jump shot.
In theory the closer you are to the basket, the easier the shot should get, but this is not the case. It could be becuase of defense, the shot type, the height difference. This data represents all shots, it would be great to see which "open" shots were taken. This would show a different color mapping. I'll see what I can hunt down and what more reading I can find.
Thanks for the links!
-chris
Re: Metrics Question Discussion
Posted: Thu Apr 09, 2015 2:06 am
by AcrossTheCourt
Chris Hoffman wrote:NateTG wrote:
After witnessing the defeat of Kentucky to Wisconsin which I think everyone is suprised about; ...
Fivethirtyeight gave them a 1 in 4 chance to lose, and Vegas had them at -5. Those aren't sky-high odds. How do we know that the Badgers didn't just have an extra lucky day? Remember, the announcers job isn't really to tell us the truth, but to entertain us.
So is time to score the only possible metric?
There are plenty of metrics. Shot location and shooter openness are probably good ones.
'Time to shoot' isn't necessarily the best indicator of offensive quality. Consider, for example, last year's 76ers who shot quickly, but poorly -
http://www.inpredictable.com/2015/04/de ... s-now.html . Inpredictable has done several posts about offensive pace that you might find interesting recently.
If Vegas had them at a low chance to win and you bet for Kentucky to win that means Vegas was very happy to see Kentucky lose because there would have been big payouts from Vegas if Kentucky went all the way. Personally I thought Notre Dame had them.
Shot location is dependant upon the player and shooter openness can be subjective. What is open for a three point shot and a drive in the paint may be valid, but what is considered open in the paint would not be considered open for a three point shot. So how do you differentiate? Time is nice because it takes the entire strategy of the offense into account, or how the coach wants his/her team to execute. The quicker the team can do that, assuming the strategy leads to points, is a positive statistic to have. If the team cannot execute the strategy, then say a shorter time of possession will be percieved as negative.
So time per field goal would be an interesting statistic, as the clock, especially when trailing, is the enemy. Time per field goal incorporates another aspect and that is team synergy. Instead of just giving the ball to the superstar and have them go at it everytime solo, I would propose that time per field goal would incorporate more of an entire team "buy In" to winning and incorporate every players positive skill set to get that FG. Teams practice set plays and time per field goal would not only show thier efficiency on offense, but show how efficient thier leadership is at designing plays. It also forces coaches to take a second look at just giving the ball to the all-star. Granted every team wants the all-star, but I think what we searching for and the spirit of what this site looks for are the undervalued players, so the question becomes what is the most valuable stat to consider? Time per field goal would be one more tool in the set of tools that can be used to value players, it would also redefine the assist and give credit or debit to all the players on the team, instead of focus on the superstar. The stats even show that the very good superstars have at least 3 assists, which means there is team synergetic buy in, and the time per field goal is a good measure of that. Sure the superstars can score 60 points a game, but how much does that build team morale and synergy and allow players to develop? I would propose that after three passes, including the inbound, time per field goal is a statistic that encompasses, 1. team synergy, 2. leadership quality, and 3. Overall team "buy in".
I am new to basketball but am trying to look at this as objective as possible, I don't understand how shot location is a good indicator of offensive capability, unless the field goal is taken into account. You can't measure shot location and relate it to a field goal as being respresented as one number, you can only have shot location represented as a percentage of success and shot location lacks the language of team synergy. For shot location to be valid to encompass team synergy, the shooter has to open and the field goal must go in. That is do-able but a stringent set of requirments. Even if you go on the assumption that the closer the shot, the higher chance the ball goes in can be challanged.
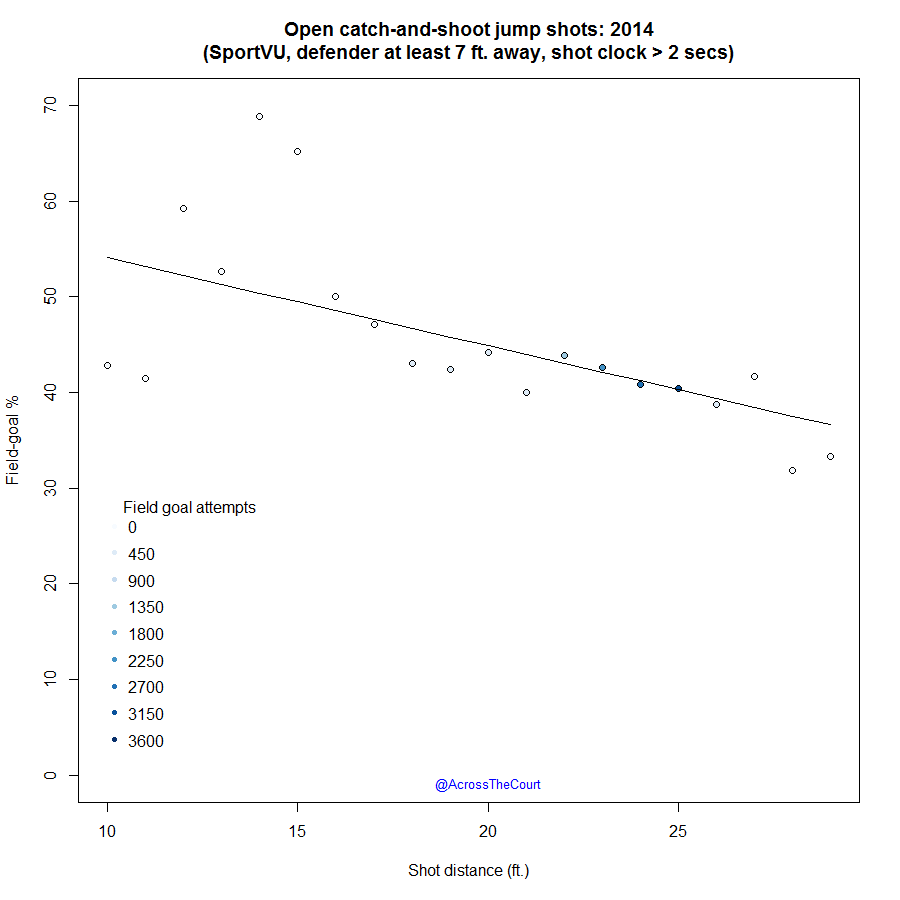
Is there a relationship between shot distance and FG percentage? There are many questions that arise with shot location.
Well, of course there's a relationship. It's easier to make one from 5 feet than 30. And even 10 than 18.
Here's what I did adjusting for defender distance too:
http://analyticsgame.com/nba/stat-explo ... ntage.html
http://bloguin.com/analyticsgame/wp-con ... ance09.png
Re: Metrics Question Discussion
Posted: Thu Apr 09, 2015 2:35 pm
by Chris Hoffman
Wow great analysis on shot location vs defender location! I can't believe the mid range jump shots only have around a 40% chance of going in when the defender is at 4 feet away. That is a pretty much open shot! These are pros! Wow just wow i would have thought open mid-range 2's at 10 feet would be like 60% or higher. Time to start training that 10 foot jumper like it going out of style!
So you used a regression model. The graphs make perfect sense, it just took a minute to figure out that the blank holes were a prediction given the previous data. It really shows alot about defense as well, its a great visualization. Defense is a really challenging thing to break.
One on one I could see moving all your players around to get someone open, but on a zone defense, you will always have these numbers and graphs to contend against. And the outliers who hook and float shot above everyone are pretty awesome because they pretty much negate the defense. I don't know how the teams keep thier offensive plays dyanmic enough to combat the zone defense, with exception of driving the paint, drawing everyone in, then pass it back for a mid range open jump shot, but the predictions show that even if the open 10 foot jump is taken with the closest defender at seven feet, the shot is only likley to go in about 40 percent of the time. At that rate why take a mid-range jump shot if the majority of talented players can't consistently make them, you might as well kick it out to the three point line and go for the extra point, since you're only sacrificing 5 percentage points to take the three. I can't believe the mid-range jump shot is practically dead because its the lowest shot percentage per defensive distance, which goes against the arguement that it should be easier to make a 10 footer than a 30 footer, but only by 5 points? That's just crazy!
Very great work on these blogs! I hope you get hired by a team soon.
Re: Metrics Question Discussion
Posted: Mon Jun 01, 2015 7:53 pm
by Crow
Any new questions or new findings?