EvanZ
Joined: 22 Nov 2010
Posts: 307
PostPosted: Thu Dec 02, 2010 9:35 am Post subject: Problems with Linear Weights Metrics Reply with quote
I have run into several instances (typically DeanO articles or posts) that discourage the use of linear weights for player metrics, but haven't been able to find a detailed explanation of the logic or theory arguing against this. Instead, what I have mostly inferred is that "basketball is complicated, and linear weights don't capture player contributions entirely". Can anyone point me to a "gold standard" article, blog post, etc, that I can gain a more complete understanding of the discussion and pitfalls of using linear weights?
As an engineer, linearity is usually your friend, and is only avoided when absolutely necessary. If a linear approach gets you to 90-95% of the truth, go with it. How much of the truth does linearity get you in analysis of basketball player value?
Also, what are the best "non-linear" metrics currently in use? I've read DSmok1's ASPM and it clearly has non-linearity built-in. Looks good, but how much improvement does it gain over the linear approach?
-evan
_________________
http://www.thecity2.com
http://www.ibb.gatech.edu/evan-zamir
Back to top
View user's profile Send private message
bbstats
Joined: 25 Apr 2010
Posts: 46
PostPosted: Thu Dec 02, 2010 10:00 am Post subject: Reply with quote
This probably won't be very helpful, but here's my experience.
Player-based statistical plus minus numbers (as introduced by Dan Rosenbaum) are pretty noisy predictors-- i.e. for the current season they have an R^2 value of ~.65.
Dean Oliver's Offensive and Defensive ratings don't do much better (i.e. ORTG*usg% - DRTG*20%) until you weight them linearly themselves - putting ORTG, usg, ORTG*usg, and DRTG in a multivariate regression. I achieved significantly higher R^2 values in doing this (unfortunately I don't remember what that was).
So I guess technically, the best measure is a non-linear system that you normalize (which would technically make it 'linear').
_________________
http://thebasketballdistribution.blogspot.com
http://twitter.com/bbstats
Back to top
View user's profile Send private message Visit poster's website
DSMok1
Joined: 05 Aug 2009
Posts: 611
Location: Where the wind comes sweeping down the plains
PostPosted: Thu Dec 02, 2010 11:18 am Post subject: Reply with quote
bbstats:
The reason for the low R^2 is not because the stats don't capture reality, it's because Neil was regressing ONTO a noisy number: APM. I think most of the issues there were from using 1 year APM data to regress onto, which is extremely noisy itself.
I think that we can get an R^2 for offense of over 0.8 to reality, probably somewhat higher. Defense is much weaker, but I still think the box score should be able to provide an R^2 over 0.5.
However, I don't know how to quantify an R^2 when most of the error is coming from what you're regressing on to!
EvanZ: another engineer (structural) here.
The big issue with using nonlinear terms is that it breaks down at the extremes, and the extremes are where the most interesting results are!
When I did my regressions to generate ASPM, I used Ilardi's 6-year APM's, which thus have much lower noise: I compiled each player's 6-year stats to do the regression. I think that is the best way to attack a SPM regression...
_________________
GodismyJudgeOK.com/DStats
Twitter.com/DSMok1
Back to top
View user's profile Send private message Send e-mail Visit poster's website
bbstats
Joined: 25 Apr 2010
Posts: 46
PostPosted: Thu Dec 02, 2010 12:24 pm Post subject: Reply with quote
Yeah, as I posted that I realized I had no idea what their SPM was regressed onto.
I should open up my old excel file rather than guessing - but I do seem to remember that for either Season-wide +/- or Season-wide Net +/- that DeanO's numbers fared better than SPM.
_________________
http://thebasketballdistribution.blogspot.com
http://twitter.com/bbstats
Back to top
View user's profile Send private message Visit poster's website
EvanZ
Joined: 22 Nov 2010
Posts: 307
PostPosted: Thu Dec 02, 2010 3:56 pm Post subject: Reply with quote
DSMok1 wrote:
The big issue with using nonlinear terms is that it breaks down at the extremes, and the extremes are where the most interesting results are!
I assume you meant to say "linear terms" break down at the extremes? Question
_________________
http://www.thecity2.com
http://www.ibb.gatech.edu/evan-zamir
Back to top
View user's profile Send private message
DSMok1
Joined: 05 Aug 2009
Posts: 611
Location: Where the wind comes sweeping down the plains
PostPosted: Thu Dec 02, 2010 6:17 pm Post subject: Reply with quote
EvanZ wrote:
DSMok1 wrote:
The big issue with using nonlinear terms is that it breaks down at the extremes, and the extremes are where the most interesting results are!
I assume you meant to say "linear terms" break down at the extremes? Question
No, nonlinear. Things like rebounds and scoring instinctively should be linear (1 rebound the same as the next, approximately). When we try to use nonlinear terms things break down whenever we consider Dennis Rodman.
Very Happy
_________________
GodismyJudgeOK.com/DStats
Twitter.com/DSMok1
Back to top
View user's profile Send private message Send e-mail Visit poster's website
EvanZ
Joined: 22 Nov 2010
Posts: 307
PostPosted: Thu Dec 02, 2010 7:35 pm Post subject: Reply with quote
DSMok1 wrote:
EvanZ wrote:
DSMok1 wrote:
The big issue with using nonlinear terms is that it breaks down at the extremes, and the extremes are where the most interesting results are!
I assume you meant to say "linear terms" break down at the extremes? Question
No, nonlinear. Things like rebounds and scoring instinctively should be linear (1 rebound the same as the next, approximately). When we try to use nonlinear terms things break down whenever we consider Dennis Rodman.
Very Happy
So, it sounds like you are not generally opposed to linear weights - I assume as long as they fit the data and have good predictive power?
_________________
http://www.thecity2.com
http://www.ibb.gatech.edu/evan-zamir
Back to top
View user's profile Send private message
DSMok1
Joined: 05 Aug 2009
Posts: 611
Location: Where the wind comes sweeping down the plains
PostPosted: Thu Dec 02, 2010 7:47 pm Post subject: Reply with quote
They're good if you understand what they can and can't do.
_________________
GodismyJudgeOK.com/DStats
Twitter.com/DSMok1
Back to top
View user's profile Send private message Send e-mail Visit poster's website
EvanZ
Joined: 22 Nov 2010
Posts: 307
PostPosted: Thu Dec 02, 2010 7:58 pm Post subject: Reply with quote
DSMok1 wrote:
They're good if you understand what they can and can't do.
OK, that's what I'm trying to understand. Care to expound?
_________________
http://www.thecity2.com
http://www.ibb.gatech.edu/evan-zamir
Back to top
View user's profile Send private message
DSMok1
Joined: 05 Aug 2009
Posts: 611
Location: Where the wind comes sweeping down the plains
PostPosted: Thu Dec 02, 2010 8:07 pm Post subject: Reply with quote
EvanZ wrote:
DSMok1 wrote:
They're good if you understand what they can and can't do.
OK, that's what I'm trying to understand. Care to expound?
1) Stats only cover some things. Box score stats (and basic advanced stats like AST% and ASTD%) cover most of offense and maybe half of defense. (Charges taken help here.)
2) Linear metrics don't capture everything the stats can tell: some stats interact in terms of player impact (assists and scoring and efficiency and turnovers and usage rate all interact, I've found).
3) Some stats that don't interact still seem to exhibit nonlinear behavior. In rebounding, really bad rebounders seem to be worse for their team than simply the lost rebounds would imply.
Those are my initial thoughts on the matter; I say this as a creator of a sometimes linear boxscore-based stat. It ain't the holy grail!
_________________
GodismyJudgeOK.com/DStats
Twitter.com/DSMok1
Back to top
View user's profile Send private message Send e-mail Visit poster's website
gabefarkas
Joined: 31 Dec 2004
Posts: 1313
Location: Durham, NC
PostPosted: Fri Dec 03, 2010 10:18 pm Post subject: Reply with quote
Generate a histogram of something like points per minute, among all players who played in 2009-2010. It's anything but linear.
Back to top
View user's profile Send private message Send e-mail AIM Address
DSMok1
Joined: 05 Aug 2009
Posts: 611
Location: Where the wind comes sweeping down the plains
PostPosted: Sat Dec 04, 2010 9:16 am Post subject: Reply with quote
gabefarkas wrote:
Generate a histogram of something like points per minute, among all players who played in 2009-2010. It's anything but linear.
Yeah, but what we're talking about is--are each of those points worth the same amount? In other words, is the EFFECT of each of those Points/Minute a linear function? Or is a player's points worth slightly more as they go higher.
Here's a graph from when I was exploring rebounding's effects on a player's APM:
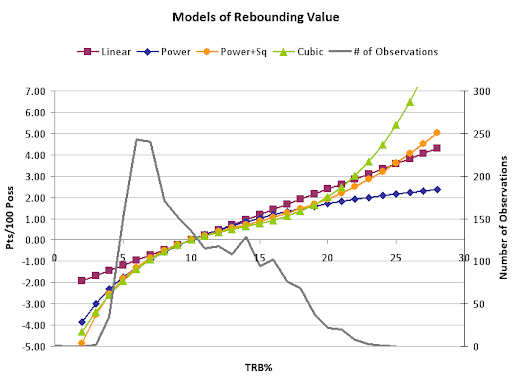
From doing the analysis, the nonlinear functions fit better, but you lose accuracy at the extremes, particularly on the cubic function. I ended up using the logarithmic function for ASPM. The cubic version obviously was broken by Dennis Rodman, whose value was extreme!
_________________
GodismyJudgeOK.com/DStats
Twitter.com/DSMok1
Back to top
View user's profile Send private message Send e-mail Visit poster's website
gabefarkas
Joined: 31 Dec 2004
Posts: 1313
Location: Durham, NC
PostPosted: Mon Dec 06, 2010 9:25 am Post subject: Reply with quote
DSMok1 wrote:
gabefarkas wrote:
Generate a histogram of something like points per minute, among all players who played in 2009-2010. It's anything but linear.
Yeah, but what we're talking about is--are each of those points worth the same amount? In other words, is the EFFECT of each of those Points/Minute a linear function? Or is a player's points worth slightly more as they go higher.
I didn't know that's what we're talking about. I thought we're talking about whether or not linear weights make sense to use. Here's a histogram of points/minute (pace-adjusted), weighted by minutes played:

Does it look normally-distributed to you? Mean is 0.412, Standard Deviation is 0.114, Skewness is 0.368, Kurtosis is 0.413.
Author Message
EvanZ
Joined: 22 Nov 2010
Posts: 265
PostPosted: Mon Dec 06, 2010 4:21 pm Post subject: Reply with quote
I'm not sure I understand the point about points (sorry). Are some points more valuable than others? I would assume that at the team level all points have equal value. If so, is it that at the player level, points have different values? Are Iverson's last 5 points more or less valuable than his first 5?
_________________
http://www.thecity2.com
http://www.ibb.gatech.edu/evan-zamir
Back to top
View user's profile Send private message
DSMok1
Joined: 05 Aug 2009
Posts: 594
Location: Where the wind comes sweeping down the plains
PostPosted: Mon Dec 06, 2010 5:02 pm Post subject: Reply with quote
EvanZ wrote:
I'm not sure I understand the point about points (sorry). Are some points more valuable than others? I would assume that at the team level all points have equal value. If so, is it that at the player level, points have different values? Are Iverson's last 5 points more or less valuable than his first 5?
This is the debate!
Are they or not? Points are complicated by efficiency, but the issue is this: there is a skill curve for each person relating the number of shots they take to how efficient they are on them. It is a scarce ability to take a lot of shots while maintaining a high efficiency level.
For rebounds, it's a little more clear: are they all the same? A rebound is a rebound at the team level, but a player that doesn't get any rebounds really hurts his team.
Here's the chart I posted:
The Linear curve does not fit the observations (where the observations are the 6-year average APM's of Ilardi) nearly as well as the other 3 curves. I would say there is clear evidence that rebounds are nonlinear at below league average (10%) rebounding rates. In other words, a player that rebounds at 3.5% is more worse than a player who rebounds at 7% than that same player at 7% is worse than a player who rebounds at 10.5%. That's an awkward way to say that, I know.
_________________
GodismyJudgeOK.com/DStats
Back to top
View user's profile Send private message Send e-mail Visit poster's website
EvanZ
Joined: 22 Nov 2010
Posts: 265
PostPosted: Mon Dec 06, 2010 5:09 pm Post subject: Reply with quote
DSMok1 wrote:
In other words, a player that rebounds at 3.5% is more worse than a player who rebounds at 7% than that same player at 7% is worse than a player who rebounds at 10.5%. That's an awkward way to say that, I know.
That would be true even for the linear case. The guy who rebounds at 3.5% is rebounding half as much as the 7% guy, whereas the 7% guy is rebounding at about 70% the level of the 10.5% guy. But each rebound still seems to have the same value at the team level.
_________________
http://www.thecity2.com
http://www.ibb.gatech.edu/evan-zamir
Back to top
View user's profile Send private message
DSMok1
Joined: 05 Aug 2009
Posts: 594
Location: Where the wind comes sweeping down the plains
PostPosted: Mon Dec 06, 2010 5:16 pm Post subject: Reply with quote
EvanZ wrote:
DSMok1 wrote:
In other words, a player that rebounds at 3.5% is more worse than a player who rebounds at 7% than that same player at 7% is worse than a player who rebounds at 10.5%. That's an awkward way to say that, I know.
That would be true even for the linear case. The guy who rebounds at 3.5% is rebounding half as much as the 7% guy, whereas the 7% guy is rebounding at about 70% the level of the 10.5% guy. But each rebound still seems to have the same value at the team level.
No, a 3.5% guy would get, say, 1 rebound in a game, the 7% guy 2, and the 10.5% guy 3. We're asking whether the difference between 1 and 2 is the same as the difference between 2 and 3, at an individual level.
Or this may be semantics. Mathematically, it's not...
_________________
GodismyJudgeOK.com/DStats
Back to top
View user's profile Send private message Send e-mail Visit poster's website
EvanZ
Joined: 22 Nov 2010
Posts: 265
PostPosted: Mon Dec 06, 2010 5:28 pm Post subject: Reply with quote
DSMok1 wrote:
EvanZ wrote:
DSMok1 wrote:
In other words, a player that rebounds at 3.5% is more worse than a player who rebounds at 7% than that same player at 7% is worse than a player who rebounds at 10.5%. That's an awkward way to say that, I know.
That would be true even for the linear case. The guy who rebounds at 3.5% is rebounding half as much as the 7% guy, whereas the 7% guy is rebounding at about 70% the level of the 10.5% guy. But each rebound still seems to have the same value at the team level.
No, a 3.5% guy would get, say, 1 rebound in a game, the 7% guy 2, and the 10.5% guy 3. We're asking whether the difference between 1 and 2 is the same as the difference between 2 and 3, at an individual level.
Or this may be semantics. Mathematically, it's not...
Still seems linear to me.
_________________
http://www.thecity2.com
http://www.ibb.gatech.edu/evan-zamir
Back to top
View user's profile Send private message
Kevin Pelton
Site Admin
Joined: 30 Dec 2004
Posts: 978
Location: Seattle
PostPosted: Tue Dec 07, 2010 1:37 am Post subject: Reply with quote
DSMok1 wrote:
An example linear weight basketball stat:
PTS + 0.4 * FG - 0.7 * FGA - 0.4*(FTA - FT) + 0.7 * ORB + 0.3 * DRB + STL + 0.7 * AST + 0.7 * BLK - 0.4 * PF - TOV
However, Evan was noting that several times leaders in the basketball advanced-stat community have disputed the accuracy of linear metrics.
Rosenbaum's SPM, for example, includes a TSA^2 term in his regression. My research shows nonlinear value for players at the extremes for specific terms; my ASPM uses quite a few nonlinear terms.
At the risk of misinterpreting DeanO, I'm not sure his point was about nonlinear terms per se as much as it was about getting out of the mold of a*PTS + b*REB, etc.
Back to top
View user's profile Send private message Send e-mail Visit poster's website
bbstats
Joined: 25 Apr 2010
Posts: 38
PostPosted: Tue Dec 07, 2010 3:53 am Post subject: Reply with quote
Kevin Pelton wrote:
At the risk of misinterpreting DeanO, I'm not sure his point was about nonlinear terms per se as much as it was about getting out of the mold of a*PTS + b*REB, etc.
Agreed. Interested in where this discussion is going though.
_________________
http://thebasketballdistribution.blogspot.com
http://twitter.com/bbstats
Back to top
View user's profile Send private message Visit poster's website
mtamada
Joined: 28 Jan 2005
Posts: 376
PostPosted: Tue Dec 07, 2010 6:50 pm Post subject: Reply with quote
Kevin Pelton wrote:
At the risk of misinterpreting DeanO, I'm not sure his point was about nonlinear terms per se as much as it was about getting out of the mold of a*PTS + b*REB, etc.
Right. There's a number of subtle points that need to be clarified, I don't have time or space to do all of them but here's a couple.
Using KevinP's example, a*PTS + b*REB is clearly a linear model.
Adding a term such as c*REB^2 makes the model somewhat nonlinear, but it is still linear IN ITS PARAMETERS (i.e. a, b, and c) and by most modellers would still be called a linear model.
We could also add interactive terms, e.g. PTS*REB or bringing in USG, and still have a model which is linear in its parameters, though not linear in the variables.
We could even do something like PTS^a * REB^b, i.e. a multiplicative model, which is seemingly nonlinear -- but then we take logarithms, and the model turns out to merely be a transformation of a linear one.
So those are all linear models, broadly speaking.
But as KevinP says, where the real nonlinearity comes in is not from any of those functional forms, but what you do with the equations. I.e. instead of focusing on an equation with a dependent variable which measures a player's contribution, quality, productivity, efficiency, or whatever as a function of a bunch of box score statistics, consider other explanatory variables and more importantly other dependent variables.
Examples: consider not the player's stats, but the other players who are on the floor. This is what APM does (ironically, using a linear functional form, so it is still a linear model in that sense, but very much not a linear function of the player's box score stats, indeed not a function of his box score stats at all).
APM also looks at a different dependent variable: not PER or player quality or anything like that but rather team success, as measured by PBP data.
And it's by bringing in those notions -- what was the success of the team, rather than the quality of the player; and who were the players on the floor -- that we get closer to what I have always called the Holy Grail of hoopstats: a model for how five players of differing quality levels and with differing strengths and weaknesses combine on the court to face five other players of varying quality and strengths, and we determine what the likely outcome is. The key questions, almost all of which are still open research questions, are how best to measure player quality in areas such as shooting, passing, defense, etc. and even more difficult, how do those qualities interact with each other when there are 9 other people on the court.
A linear model, such as adding up the PER or WinLoss% or whatever of your five players and subtracting the PER or WinLoss% of the five opponents is not likely to work. Even comparing the APM of your five vs the opponents' APM only works if team outcomes are determined by the sum of APMs, which might or might not be a horrible approximation.
I.e. the need for nonlinear models.
The whole discussion is easier if we focus on the original question, which was not about linear models per se but about linear weights models, a much more narrow and specific category whichs brings us all the way back to the simplest models, and their attendant weaknesses. But as bbstats says, the discussion wandered from that original more narrow topic, and people got to make comments on a number of things.
Last edited by mtamada on Tue Dec 07, 2010 8:35 pm; edited 1 time in total
Back to top
View user's profile Send private message
DSMok1
Joined: 05 Aug 2009
Posts: 594
Location: Where the wind comes sweeping down the plains
PostPosted: Tue Dec 07, 2010 7:10 pm Post subject: Reply with quote
Thanks a lot, Mike. That clarifies things.
_________________
GodismyJudgeOK.com/DStats
Back to top
View user's profile Send private message Send e-mail AIM Address
DSMok1
Joined: 05 Aug 2009
Posts: 611
Location: Where the wind comes sweeping down the plains
PostPosted: Mon Dec 06, 2010 10:33 am Post subject: Reply with quote
A linear-weights style metric simply counts all rebounds the same, all points the same, all minutes the same. That's what linear weights metrics do; they are quite common in baseball where it seems they are the proper approach to context-independent value stats.
An example linear weight basketball stat:
PTS + 0.4 * FG - 0.7 * FGA - 0.4*(FTA - FT) + 0.7 * ORB + 0.3 * DRB + STL + 0.7 * AST + 0.7 * BLK - 0.4 * PF - TOV
(That's Game Score.)
However, Evan was noting that several times leaders in the basketball advanced-stat community have disputed the accuracy of linear metrics.
Rosenbaum's SPM, for example, includes a TSA^2 term in his regression. My research shows nonlinear value for players at the extremes for specific terms; my ASPM uses quite a few nonlinear terms.
Are you saying that because points/game is not normally distributed, valuing each point scored as a linear function of value per point doesn't make sense?
_________________
GodismyJudgeOK.com/DStats
Twitter.com/DSMok1
Back to top
View user's profile Send private message Send e-mail Visit poster's website
gabefarkas
Joined: 31 Dec 2004
Posts: 1313
Location: Durham, NC
PostPosted: Mon Dec 06, 2010 3:02 pm Post subject: Reply with quote
DSMok1 wrote:
Are you saying that because points/game is not normally distributed, valuing each point scored as a linear function of value per point doesn't make sense?
Just to be clear, it would be that valuing each additional point per minute increase as a linear function wouldn't make sense.
But yes, that's basically what I'm saying.
In theory.
In practice, it's a whole other story...