Kobe Bryant and All-Time Ranking of Players

Home for all your discussion of basketball statistical analysis.
DSMok1
Posts: 1119
Joined: Thu Apr 14, 2011 11:18 pm
Location: Maine
Contact:

Re: Kobe Bryant and All-Time Ranking of Players

Post by DSMok1 »

And here is my top 25, with the era/league adjustments applied:

Code: Select all

╔══════╦═════════════════════╦═════════════╦═════════════════╦════════════════════════╦══════════════╦═════════════════════╗
║ Rank ║       player        ║ Hall_Rating ║ Reg_Season_Rank ║ Reg_Season_Hall_Rating ║ Playoff_Rank ║ Playoff_Hall_Rating ║
╠══════╬═════════════════════╬═════════════╬═════════════════╬════════════════════════╬══════════════╬═════════════════════╣
║    1 ║ Kareem Abdul-Jabbar ║ 239.5       ║               2 ║ 145.4                  ║            3 ║ 94.1                ║
║    2 ║ Michael Jordan      ║ 238.2       ║               3 ║ 137.5                  ║            2 ║ 100.7               ║
║    3 ║ Wilt Chamberlain    ║ 231.6       ║               1 ║ 151.0                  ║            6 ║ 80.6                ║
║    4 ║ LeBron James        ║ 211.1       ║               4 ║ 121.7                  ║            4 ║ 89.4                ║
║    5 ║ Magic Johnson       ║ 200.7       ║               9 ║ 99.2                   ║            1 ║ 101.4               ║
║    6 ║ Bill Russell        ║ 178.2       ║              11 ║ 94.7                   ║            5 ║ 83.5                ║
║    7 ║ Tim Duncan          ║ 162.2       ║              12 ║ 92.2                   ║            7 ║ 70.0                ║
║    8 ║ Larry Bird          ║ 162.0       ║              10 ║ 97.1                   ║            9 ║ 64.9                ║
║    9 ║ Karl Malone         ║ 156.4       ║               5 ║ 120.1                  ║           19 ║ 36.3                ║
║   10 ║ Jerry West          ║ 155.6       ║              14 ║ 86.1                   ║            8 ║ 69.5                ║
║   11 ║ Charles Barkley     ║ 149.6       ║               6 ║ 113.1                  ║           18 ║ 36.5                ║
║   12 ║ Shaquille O'Neal    ║ 142.5       ║              18 ║ 81.1                   ║           10 ║ 61.5                ║
║   13 ║ Julius Erving       ║ 138.1       ║              16 ║ 82.0                   ║           11 ║ 56.0                ║
║   14 ║ David Robinson      ║ 135.1       ║               7 ║ 101.8                  ║           22 ║ 33.3                ║
║   15 ║ Hakeem Olajuwon     ║ 131.6       ║              17 ║ 82.0                   ║           14 ║ 49.7                ║
║   16 ║ Oscar Robertson     ║ 129.8       ║               8 ║ 100.1                  ║           35 ║ 29.6                ║
║   17 ║ Kobe Bryant         ║ 119.5       ║              24 ║ 68.0                   ║           13 ║ 51.5                ║
║   18 ║ Bob Pettit          ║ 119.0       ║              15 ║ 85.8                   ║           23 ║ 33.2                ║
║   19 ║ Clyde Drexler       ║ 113.8       ║              19 ║ 77.2                   ║           17 ║ 36.6                ║
║   20 ║ Scottie Pippen      ║ 112.5       ║              26 ║ 57.9                   ║           12 ║ 54.6                ║
║   21 ║ Kevin Garnett       ║ 108.7       ║              13 ║ 89.5                   ║           57 ║ 19.2                ║
║   22 ║ John Stockton       ║ 107.4       ║              20 ║ 76.7                   ║           32 ║ 30.7                ║
║   23 ║ Dolph Schayes       ║ 101.4       ║              25 ║ 66.3                   ║           21 ║ 35.1                ║
║   24 ║ Dirk Nowitzki       ║ 98.5        ║              23 ║ 68.0                   ║           33 ║ 30.5                ║
║   25 ║ Artis Gilmore       ║ 90.2        ║              22 ║ 69.1                   ║           50 ║ 21.1                ║
╚══════╩═════════════════════╩═════════════╩═════════════════╩════════════════════════╩══════════════╩═════════════════════╝
Developer of Box Plus/Minus
APBRmetrics Forum Administrator
Twitter.com/DSMok1
schtevie
Posts: 377
Joined: Thu Apr 14, 2011 11:24 pm

Re: Kobe Bryant and All-Time Ranking of Players

Post by schtevie »

Daniel, apologies if it is recently or obviously posted, but could you please describe what your era/league adjustments are? And, if inclined, also explain why you consider these to be appropriate.
DSMok1
Posts: 1119
Joined: Thu Apr 14, 2011 11:18 pm
Location: Maine
Contact:

Re: Kobe Bryant and All-Time Ranking of Players

Post by DSMok1 »

schtevie wrote:Daniel, apologies if it is recently or obviously posted, but could you please describe what your era/league adjustments are? And, if inclined, also explain why you consider these to be appropriate.
Well, I feel it is self-evident that certain seasons or areas would necessarily be stronger in terms of talent. Neil Paine several years ago worked out some preliminary era adjustments using the early version of my box plus/minus.

I expanded on his approach, which is built upon looking at a set of players in each year, and seeing which one they performed better on average in, and assuming the overall talent level was lower in that season. So that is similar to the year to year Delta approach to developing aging curves, and in fact developing an aging curve is required to do the era adjustment curve. I used players from age of 23 to 29 and I adjusted for the small amount of it aging Delta that occurs within those seasons.

The result is that players that played in the 1960s and 1980s saw a stiffer level of competition than those who played in the 1970s or 2000s.

Note, such an approach does not account for league-wide changes that benefited all players equally. This, I feel, is a good thing, because it allows us to look at what the talent level Was really doing.
Developer of Box Plus/Minus
APBRmetrics Forum Administrator
Twitter.com/DSMok1
jbrocato23
Posts: 105
Joined: Thu Jul 26, 2012 8:49 pm
Location: Dallas, TX

Re: Kobe Bryant and All-Time Ranking of Players

Post by jbrocato23 »

I created a metric called "expected titles" a few years ago: http://shutupandjam.net/nba-ncaa-stats/ ... ed-impact/ ...hasn't been updated for a over a year, but it's still interesting I think.
Crow
Posts: 10533
Joined: Thu Apr 14, 2011 11:10 pm

Re: Kobe Bryant and All-Time Ranking of Players

Post by Crow »

62 with at least one full "expected title" estimate and at least 17 didn't actually get one, or about 27%. KD, Chris Paul and D Howard have past this threshold and lead the active players on talent creating expectation of title.
Mike G
Posts: 6144
Joined: Fri Apr 15, 2011 12:02 am
Location: Asheville, NC

Re: Kobe Bryant and All-Time Ranking of Players

Post by Mike G »

DSMok1 wrote:...
2. All series that were played, however, will be scaled up to have gone 7 games, no matter how long they actually were (I don't want to penalize sweeps, or 5 game series!)
3. Instead of weighting all playoff series x2 vs. regular season, I have adopted the following multipliers: 4x for Finals, 3x for conference finals, 2x for conf semi finals, and 1x for first round series. This makes sense to me, keeps an overall average of x2, and at the same time doesn't penalize older players for not playing the first round or two very much.
#2 is pretty innovative and potentially awesome. It could be hard to really standardize, though. Do players on winning teams generally get more Wins (WS or equiv.) in a 4-3 series than they would in a 4-0 series?
Does a 2-0 mini-series sweep get scaled up to 7-0?

On #3, I'm extremely unclear. How do you reach the Finals without playing in a 1st or 2nd round?

In the last 5 postseasons, 80 playoff teams have avg RS SRS of 3.22
That would also be the avg 1st-round opponent SRS.
Compare that to the Russell Celtics' opponent SRS:

Code: Select all

year     1st    2nd   3rd
1957   -1.03   -.27   
1958     .21    .82   
1959    3.74  -1.42   
1960    2.77   1.77   
1961    1.93   2.99   
1962    2.63   1.80   
1963    1.24   2.67   
1964    4.43   4.41   
1965   - .13   1.70   
1966    1.03   4.16   2.76
1967   -2.74   8.50   
1968   -1.70   7.96   4.99
1969    4.79   5.48   3.84

avg     1.32   3.12   3.86
Before 1966, the 2nd rd opponents were their Finals opponents; avg SRS = 1.61
Once they were deposed from RS dominance, they lost their 1st round bye and got to beat some patsies. But after that, fierce competition.
This brings their (12) Finals opponents' avg SRS to 2.17 -- still not quite equivalent to a 1st round matchup today.
DSMok1
Posts: 1119
Joined: Thu Apr 14, 2011 11:18 pm
Location: Maine
Contact:

Re: Kobe Bryant and All-Time Ranking of Players

Post by DSMok1 »

Mike G wrote:
DSMok1 wrote:...
2. All series that were played, however, will be scaled up to have gone 7 games, no matter how long they actually were (I don't want to penalize sweeps, or 5 game series!)
3. Instead of weighting all playoff series x2 vs. regular season, I have adopted the following multipliers: 4x for Finals, 3x for conference finals, 2x for conf semi finals, and 1x for first round series. This makes sense to me, keeps an overall average of x2, and at the same time doesn't penalize older players for not playing the first round or two very much.
#2 is pretty innovative and potentially awesome. It could be hard to really standardize, though. Do players on winning teams generally get more Wins (WS or equiv.) in a 4-3 series than they would in a 4-0 series?
Does a 2-0 mini-series sweep get scaled up to 7-0?

On #3, I'm extremely unclear. How do you reach the Finals without playing in a 1st or 2nd round?

In the last 5 postseasons, 80 playoff teams have avg RS SRS of 3.22
That would also be the avg 1st-round opponent SRS.
Compare that to the Russell Celtics' opponent SRS:

Code: Select all

year     1st    2nd   3rd
1957   -1.03   -.27   
1958     .21    .82   
1959    3.74  -1.42   
1960    2.77   1.77   
1961    1.93   2.99   
1962    2.63   1.80   
1963    1.24   2.67   
1964    4.43   4.41   
1965   - .13   1.70   
1966    1.03   4.16   2.76
1967   -2.74   8.50   
1968   -1.70   7.96   4.99
1969    4.79   5.48   3.84

avg     1.32   3.12   3.86
Before 1966, the 2nd rd opponents were their Finals opponents; avg SRS = 1.61
Once they were deposed from RS dominance, they lost their 1st round bye and got to beat some patsies. But after that, fierce competition.
This brings their (12) Finals opponents' avg SRS to 2.17 -- still not quite equivalent to a 1st round matchup today.
1. I think it makes sense to have all series go 7, so a 4-4-4 run wouldn't get less minutes than a 7-7-7 run in the weights. Each player's individual rates are only tangentially related to whether the team won or lost.

2. Long, long ago there were more byes in the system, as you mention here with the Celtics.

3. This is a good point for me to think about--how does SoS differ? I had been applying a flat adjustment, but I may need to revisit that. Back then, there were only a handful of teams, so it was rare to get a really high SRS. If there's 8 teams on a bell curve.... then the 2nd best team would be similar to the ... 6th? best team today.
Developer of Box Plus/Minus
APBRmetrics Forum Administrator
Twitter.com/DSMok1
Mike G
Posts: 6144
Joined: Fri Apr 15, 2011 12:02 am
Location: Asheville, NC

Re: Kobe Bryant and All-Time Ranking of Players

Post by Mike G »

In the last 4 postseasons, 60 playoff series, the avg Pythagorean wins for winners and losers in 4-7 game series:

Code: Select all

G    pyW    pyL    pyW7  pyL7
4   3.36   0.64     5.9   1.1
5   3.81   1.19     5.3   1.7
6   4.00   2.00     4.7   2.3
7   3.85   3.15     3.8   3.2
The last two columns are scaled up to 7 games.

Obviously, in 7 games everyone gets more points, rebounds, etc, than they do in shorter series.
But when you allocate something like player wins, win shares, etc, the winners don't necessarily get more in additional games.

In the 1956 playoffs, the Hawks beat the Lakers in a best-of-3, despite being outscored by 19 pts per game.
pyWins register 2.74 - 0.26, for the losers.
http://www.basketball-reference.com/pla ... hawks.html
Multiply by 7/3 and you get 6.39 equivalent 7-game pyW for a team that won only 1 game.
DSMok1
Posts: 1119
Joined: Thu Apr 14, 2011 11:18 pm
Location: Maine
Contact:

Re: Kobe Bryant and All-Time Ranking of Players

Post by DSMok1 »

OK, I adjusted all playoff ratings based on the actual quality of teams involved.

Here are the updated ratings:

Code: Select all

╔══════╦═════════════════════╦═════════════╦═════════════════╦════════════════════════╦══════════════╦═════════════════════╦══════════╦═════════╦═════════╦═══════════╦══════════╗
║ Rank ║       player        ║ Hall_Rating ║ Reg_Season_Rank ║ Reg_Season_Hall_Rating ║ Playoff_Rank ║ Playoff_Hall_Rating ║ Position ║ Minutes ║ Seasons ║ Rookie_Yr ║ Final_Yr ║
╠══════╬═════════════════════╬═════════════╬═════════════════╬════════════════════════╬══════════════╬═════════════════════╬══════════╬═════════╬═════════╬═══════════╬══════════╣
║    1 ║ Michael Jordan      ║ 238.0       ║               3 ║ 137.5                  ║            1 ║ 100.5               ║ SG       ║   48485 ║      15 ║      1985 ║     2003 ║
║    2 ║ Kareem Abdul-Jabbar ║ 234.9       ║               2 ║ 145.4                  ║            3 ║ 89.6                ║ C        ║   66297 ║      20 ║      1970 ║     1989 ║
║    3 ║ Wilt Chamberlain    ║ 224.7       ║               1 ║ 151.0                  ║            5 ║ 73.6                ║ C        ║   55418 ║      14 ║      1960 ║     1973 ║
║    4 ║ LeBron James        ║ 209.3       ║               4 ║ 121.7                  ║            4 ║ 87.5                ║ SF       ║   43801 ║      13 ║      2004 ║     2016 ║
║    5 ║ Magic Johnson       ║ 196.6       ║               9 ║ 99.2                   ║            2 ║ 97.4                ║ PG       ║   40783 ║      13 ║      1980 ║     1996 ║
║    6 ║ Bill Russell        ║ 168.1       ║              11 ║ 94.7                   ║            6 ║ 73.3                ║ C        ║   48223 ║      13 ║      1957 ║     1969 ║
║    7 ║ Tim Duncan          ║ 161.5       ║              12 ║ 92.2                   ║            7 ║ 69.3                ║ PF       ║   55338 ║      19 ║      1998 ║     2016 ║
║    8 ║ Larry Bird          ║ 160.3       ║              10 ║ 97.1                   ║            8 ║ 63.2                ║ SF       ║   41329 ║      13 ║      1980 ║     1992 ║
║    9 ║ Karl Malone         ║ 155.4       ║               5 ║ 120.1                  ║           16 ║ 35.3                ║ PF       ║   62759 ║      19 ║      1986 ║     2004 ║
║   10 ║ Charles Barkley     ║ 148.4       ║               6 ║ 113.1                  ║           15 ║ 35.3                ║ PF       ║   44179 ║      16 ║      1985 ║     2000 ║
║   11 ║ Jerry West          ║ 146.1       ║              14 ║ 86.1                   ║           10 ║ 59.9                ║ PG       ║   42892 ║      14 ║      1961 ║     1974 ║
║   12 ║ Shaquille O'Neal    ║ 141.4       ║              18 ║ 81.1                   ║            9 ║ 60.4                ║ C        ║   50016 ║      19 ║      1993 ║     2011 ║
║   13 ║ David Robinson      ║ 134.2       ║               7 ║ 101.8                  ║           20 ║ 32.4                ║ C        ║   38492 ║      14 ║      1990 ║     2003 ║
║   14 ║ Hakeem Olajuwon     ║ 129.5       ║              17 ║ 82.0                   ║           13 ║ 47.5                ║ C        ║   49971 ║      18 ║      1985 ║     2002 ║
║   15 ║ Oscar Robertson     ║ 126.9       ║               8 ║ 100.1                  ║           33 ║ 26.8                ║ PG       ║   47559 ║      14 ║      1961 ║     1974 ║
║   16 ║ Kobe Bryant         ║ 118.3       ║              24 ║ 68.0                   ║           12 ║ 50.3                ║ SG       ║   55726 ║      20 ║      1997 ║     2016 ║
║   17 ║ Julius Erving       ║ 115.1       ║              16 ║ 82.0                   ║           18 ║ 33.1                ║ SF       ║   50515 ║      16 ║      1972 ║     1987 ║
║   18 ║ Clyde Drexler       ║ 112.5       ║              19 ║ 77.2                   ║           14 ║ 35.3                ║ SG       ║   43109 ║      15 ║      1984 ║     1998 ║
║   19 ║ Scottie Pippen      ║ 112.5       ║              26 ║ 57.9                   ║           11 ║ 54.6                ║ SF       ║   49174 ║      17 ║      1988 ║     2004 ║
║   20 ║ Bob Pettit          ║ 111.0       ║              15 ║ 85.8                   ║           35 ║ 25.2                ║ PF       ║   34235 ║      11 ║      1955 ║     1965 ║
║   21 ║ Kevin Garnett       ║ 108.2       ║              13 ║ 89.5                   ║           48 ║ 18.7                ║ PF       ║   55317 ║      21 ║      1996 ║     2016 ║
║   22 ║ John Stockton       ║ 106.5       ║              20 ║ 76.7                   ║           28 ║ 29.8                ║ PG       ║   54162 ║      19 ║      1985 ║     2003 ║
║   23 ║ Dirk Nowitzki       ║ 98.0        ║              23 ║ 68.0                   ║           26 ║ 30.0                ║ PF       ║   50991 ║      18 ║      1999 ║     2016 ║
║   24 ║ Dolph Schayes       ║ 96.1        ║              25 ║ 66.3                   ║           27 ║ 29.9                ║ PF       ║   32487 ║      13 ║      1952 ║     1964 ║
║   25 ║ Chris Paul          ║ 90.1        ║              21 ║ 74.9                   ║           62 ║ 15.2                ║ PG       ║   28128 ║      11 ║      2006 ║     2016 ║
╚══════╩═════════════════════╩═════════════╩═════════════════╩════════════════════════╩══════════════╩═════════════════════╩══════════╩═════════╩═════════╩═══════════╩══════════╝
Developer of Box Plus/Minus
APBRmetrics Forum Administrator
Twitter.com/DSMok1
Mike G
Posts: 6144
Joined: Fri Apr 15, 2011 12:02 am
Location: Asheville, NC

Re: Kobe Bryant and All-Time Ranking of Players

Post by Mike G »

I see Magic and Bird are a lot closer together now. Presumably the effect of the Celtics' relatively tougher path to the Finals most of those years.
That's quite an admirable contribution, to include playoff SOS. Odd that b-r.com doesn't do this.

Can't quite wrap my head around Wilt having a greater playoff rating than Russell or Duncan.
He played a few more minutes than Russ, with .200 WS/48 vs .178 for Russell.
Does winning the Finals get any more consideration than just getting there?

Wilt vs Duncan: Duncan has .197 WS/48 in playoffs, with 20% more minutes and several more titles.
PER: Duncan 24.6 - 22.7 Wilt.
http://bkref.com/tiny/2Qlxm

In Wilt's time, playoffs were less exclusive; consequently the competition was diluted, and players got more playoff minutes per year, on avg.
This means '60s playoff totals are already inflated, relative to later eras. Is there any reason at all to puff them up further?
viewtopic.php?f=2&t=9048&start=44

P.S: Erving has dropped, and Gilmore is gone. Did you devalue the ABA?
DSMok1
Posts: 1119
Joined: Thu Apr 14, 2011 11:18 pm
Location: Maine
Contact:

Re: Kobe Bryant and All-Time Ranking of Players

Post by DSMok1 »

Mike G wrote:I see Magic and Bird are a lot closer together now. Presumably the effect of the Celtics' relatively tougher path to the Finals most of those years.
That's quite an admirable contribution, to include playoff SOS. Odd that b-r.com doesn't do this.

Can't quite wrap my head around Wilt having a greater playoff rating than Russell or Duncan.
He played a few more minutes than Russ, with .200 WS/48 vs .178 for Russell.
Does winning the Finals get any more consideration than just getting there?

Wilt vs Duncan: Duncan has .197 WS/48 in playoffs, with 20% more minutes and several more titles.
PER: Duncan 24.6 - 22.7 Wilt.
http://bkref.com/tiny/2Qlxm

In Wilt's time, playoffs were less exclusive; consequently the competition was diluted, and players got more playoff minutes per year, on avg.
This means '60s playoff totals are already inflated, relative to later eras. Is there any reason at all to puff them up further?
viewtopic.php?f=2&t=9048&start=44

P.S: Erving has dropped, and Gilmore is gone. Did you devalue the ABA?
I'll look into the Wilt playoff effect; I'm not sure exactly what's going on. Winning the finals does not have any greater effect than getting there; all "Finals" production is weighted the same. I did adjust for the playoff roads, so that's not it. I think Wilt's minutes in the playoffs were in general in higher-leverage rounds, since there was no first round back then. If you'll remember, I'm weighting the 4 rounds currently at 1-2-3-4, with finals production x4 and first round at x1.

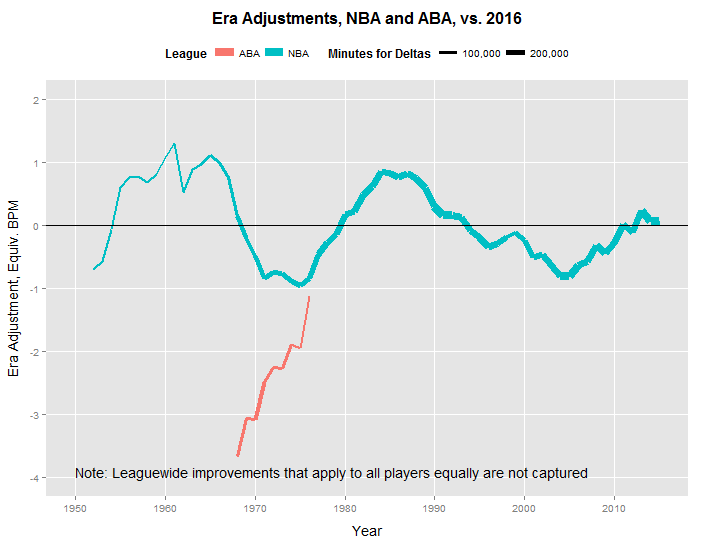
I ran a full era adjustment for everything, which helps the 1960s and 1980s and hurts the 1970s and particularly the ABA. Here's the adjustment chart:

Image

It's very interesting. This looks at all players near their peak that played in both seasons, and sees whether they perform better in the first or second season, adjusted for aging. Statistically, there is a fair amount of error possible, not in the overall shape of the adjustment curve, but in the overall slope--in other words, it is quite possible the left end of the line should be moved up or down a point or two do to some slight systematic bias. So take it with a grain of salt.
Developer of Box Plus/Minus
APBRmetrics Forum Administrator
Twitter.com/DSMok1
Mike G
Posts: 6144
Joined: Fri Apr 15, 2011 12:02 am
Location: Asheville, NC

Re: Kobe Bryant and All-Time Ranking of Players

Post by Mike G »

This is very good to see this as a chart. Thanks for presenting it.
We should keep in mind that the whole up and down path of competitiveness is almost entirely within 1 point of normal. So a sharp spike, such as the downward plunge from '61 to '62, is basically the result of one expansion team being added to the existing 8.

The great expansion of '68-'71 drives NBA values down to historic lows. The ABA is a big part of this, especially as most of the top draft picks went there for a few years.
The ascendency of the ABA is a bit jerky, too, as a number of their stars defected to (or back to) the NBA.

In the rise from 1977 to 1984, there's just a little ledge seen in '81, when the Mavs joined.
Expansions in '89 and '90, again in '96, wouldn't seem to be justified -- competition was already heading downward.
... it is quite possible the left end of the line should be moved up or down a point or two do to some slight systematic bias...
If you press the left end downward, the right (recent) end moves up?
That would make it better resemble what I got when looking at player minutes and rebound rates from year to year. I used just the 24-28 year old population.

What about using minutes, PER, WS/48 in this study?
Mike G
Posts: 6144
Joined: Fri Apr 15, 2011 12:02 am
Location: Asheville, NC

Re: Kobe Bryant and All-Time Ranking of Players

Post by Mike G »

Here's a table with 7 different interpretations of year-to-year competitiveness in minutes and rebounds.
I can't seem to find the spreadsheet with formulas; just the values you see here.
Column headers represent possible biases from olden days to recent times. Each column assumes a constant bias over time. The 1.000 column assumes no bias: The values for each season are unadjusted cumulative multiples of (averaged) RebRt and Min ratios, from yr1 to yr2.
1977 was the midpoint of the original study, so it is defined as 1.00, or historic avg competitive level.

Code: Select all

Sea1   Min12   Reb12    Sea2    .990   .995   .998   1.00   1.002  1.005  1.010   Sea2
1952   1.018    .976    1953    1.05    .93    .87    .82    .79    .73    .65    1953
1953    .965   1.010    1954    1.05    .94    .87    .84    .80    .74    .66    1954
1954    .889    .968    1955    1.12   1.01    .94    .90    .86    .81    .72    1955
1955    .941    .945    1956    1.18   1.06   1.00    .95    .92    .86    .77    1956
1956   1.063    .954    1957    1.16   1.05    .99    .95    .91    .86    .78    1957
1957   1.012    .974    1958    1.16   1.05    .99    .95    .92    .87    .79    1958
1958   1.064    .983    1959    1.12   1.02    .97    .93    .90    .85    .78    1959
1959   1.018    .933    1960    1.14   1.04    .99    .96    .93    .88    .81    1960
1960   1.006    .989    1961    1.13   1.04    .99    .96    .93    .89    .82    1961
1961   1.015   1.013    1962    1.10   1.02    .98    .95    .92    .88    .82    1962
1962    .926    .943    1963    1.17   1.09   1.04   1.01    .99    .95    .88    1963
1963   1.025    .954    1964    1.17   1.09   1.05   1.03   1.00    .96    .90    1964
1964    .984    .970    1965    1.18   1.11   1.07   1.05   1.02    .99    .93    1965
1965   1.023   1.016    1966    1.15   1.09   1.05   1.03   1.01    .97    .92    1966
1966   1.088   1.020    1967    1.08   1.03   1.00    .98    .96    .93    .88    1967
1967   1.233    .966    1968     .98    .94    .91    .89    .88    .86    .82    1968
1968   1.127    .983    1969     .92    .88    .86    .85    .84    .82    .79    1969
1969   1.018    .995    1970     .91    .88    .86    .84    .83    .82    .79    1970
1970   1.094    .958    1971     .88    .85    .84    .83    .82    .80    .78    1971
1971    .936   1.030    1972     .88    .86    .85    .84    .83    .82    .80    1972
1972    .984    .986    1973     .89    .87    .86    .85    .85    .84    .82    1973
1973    .942   1.015    1974     .90    .89    .88    .87    .87    .86    .85    1974
1974    .977    .959    1975     .92    .91    .91    .90    .90    .89    .88    1975
1975    .972    .984    1976     .93    .93    .92    .92    .92    .92    .91    1976
1976    .879    .966    1977    1.00   1.00   1.00   1.00   1.00   1.00   1.00    1977
1977    .986    .995    1978    1.00   1.00   1.01   1.01   1.01   1.01   1.02    1978
1978    .937   1.011    1979    1.02   1.03   1.03   1.04   1.04   1.05   1.06    1979
1979    .945    .964    1980    1.05   1.07   1.08   1.09   1.09   1.10   1.12    1980
1980   1.042    .970    1981    1.04   1.06   1.07   1.08   1.09   1.10   1.12    1981
1981    .932   1.010    1982    1.06   1.09   1.10   1.11   1.13   1.14   1.17    1982
1982    .983    .992    1983    1.06   1.09   1.11   1.13   1.14   1.16   1.20    1983
1983    .969    .994    1984    1.07   1.11   1.13   1.15   1.17   1.19   1.23    1984
1984    .972    .990    1985    1.08   1.13   1.15   1.17   1.19   1.22   1.27    1985
1985    .928    .984    1986    1.12   1.17   1.20   1.23   1.25   1.28   1.34    1986
1986   1.027    .967    1987    1.11   1.17   1.21   1.23   1.25   1.29   1.36    1987
1987   1.015    .990    1988    1.10   1.16   1.20   1.23   1.25   1.30   1.37    1988
1988   1.038   1.017    1989    1.06   1.12   1.17   1.19   1.22   1.27   1.35    1989
1989   1.073    .992    1990    1.02   1.08   1.13   1.16   1.19   1.24   1.32    1990
1990    .987   1.003    1991    1.01   1.09   1.13   1.16   1.20   1.25   1.34    1991
1991   1.093    .959    1992     .98   1.05   1.10   1.14   1.17   1.23   1.32    1992
1992   1.052    .988    1993     .95   1.03   1.08   1.12   1.15   1.21   1.31    1993
1993    .967    .977    1994     .97   1.05   1.11   1.15   1.19   1.25   1.36    1994
1994   1.006    .966    1995     .97   1.06   1.12   1.16   1.21   1.27   1.39    1995
1995   1.024   1.011    1996     .94   1.04   1.10   1.14   1.19   1.26   1.38    1996
1996    .981    .934    1997     .98   1.08   1.15   1.19   1.24   1.32   1.46    1997
1997    .960    .996    1998     .99   1.10   1.17   1.22   1.27   1.36   1.51    1998
1998    .964   1.080    1999     .96   1.07   1.15   1.20   1.25   1.34   1.49    1999
1999   1.014    .976    2000     .96   1.07   1.15   1.20   1.26   1.35   1.51    2000
2000   1.043    .982    2001     .93   1.05   1.13   1.19   1.25   1.34   1.51    2001
2001   1.050   1.025    2002     .89   1.01   1.09   1.15   1.20   1.30   1.47    2002
2002    .997    .954    2003     .90   1.03   1.12   1.17   1.24   1.34   1.52    2003
2003   1.000    .967    2004     .91   1.04   1.13   1.19   1.26   1.37   1.56    2004
2004   1.008   1.032    2005     .88   1.02   1.11   1.17   1.24   1.35   1.55    2005
2005   1.028   1.017    2006     .86    .99   1.08   1.15   1.21   1.32   1.53    2006
2006    .938   1.013    2007     .87   1.01   1.11   1.17   1.25   1.36   1.58    2007
The left- and right-most biases -- .99 and 1.01 -- may well be absurd values.
In the .998 column, the zenith of 1986-88 passes and is never again approached (as of 2007).
In the 1.000 standard, we almost get back there in 1998.
If 1.002 is the annual adjustment (and higher), the 21st century is best of all.
schtevie
Posts: 377
Joined: Thu Apr 14, 2011 11:24 pm

Re: Kobe Bryant and All-Time Ranking of Players

Post by schtevie »

Before offering some comments on Daniel's plot of Era Adjustments (what is a very, very interesting topic of conversation) I feel obliged, as a hostile witness, to cast some shade (yet again) on this larger endeavor. Though I understand how attractive the goal is to some to establish an All-Time Ranking of Players, the exercise is inherently embedded with heroic assumptions (both in terms of criteria and methods - written in fine print, if at all) making the output unfit for general consumption.

What inspires me in the instance to be cranky is actually on topic though, as it relates to the career contributions of All Star Ballot-leading Kobe Bryant! Rather than invoke a "laugh test", I propose instead a "KG-KB test" as a basic test of any attempt at All-Time Ranking. By this, I mean that if a ranking doesn't impose rationality on the relative value of Kevin Garnett vs. Kobe Bryant, it should be back to the drawing board.

First, an honest question: what has been established as the dominant metric for player evaluation in a given year? My understanding is that the clear answer for overall contributions is prior-informed RAPM, owing especially to the strong dominance of its defensive component. If this is correct, there are some direct implications that are perhaps most clearly viewed when comparing the careers of Kevin Garnett and Kobe Bryant, as they almost perfectly overlap in term of years and have similar regular-season minutes.

And here the BPM vs. xRAPM stories are very different. Folks frequenting this forum are probably familiar with the general story, but one statistic reveals the bottom line. Looking at data from 2001 to present (corresponding with play-by-play data availability, though the story is compatible with earlier estimates based on quarterly data) annual averages show that KG's margin of +/- regular-season superiority to KB increases from +1.5 with BPM to +2.7 with xRAPM (using Jeremias' numbers until 2013 then his and Stephen Ilardi's to present) and all this increase owes to defensive contributions showing up in DxRPM.

OK. But so what? Well, a whole lot of what. The only reason to care about an All-Time Ranking is to get things ordinally correct at the top of the list. And the second-best metric (BPM) does what it can but it doesn't do enough. But perhaps the KG/KB issue is sui generis? Nonsense. There's similarly hard data on Tim Duncan, indicating that his defensive contributions are undervalued. Hakeem's rank is similarly suspicious, and David Robinson too I think. And then what about Bill Russell, who was only really a defensive standout?

And then there is a whole other issue regarding the relative valuation of post-season accomplishments - what is also topical in the KG-KB context.

There seems to be a hasty consensus that post-season contributions should be automatically entered into the formula for All-Time Ranking in what is an effective premium, especially for participation in later rounds, and this, it seems to me, is a conceptual error. The only post-season fillip (positive or negative) to All-Time Rankings should reflect contributions in what were earned, not gifted, post-season opportunities.

To illustrate the intended point, consider the careers of KG vs. KB. Throughout, KB was blessed with being teamed with (very) superior talent, relative to contemporaries. Conversely, KG, not so much. And this unearned privilege allowed KB to appear not only in more first round series, but also, in expectation, many more later-round series.

So, a positive suggestion, for those dedicated to carrying on in this misguided general endeavor, would be to come up with a scheme for determining a fair weight for post-season contributions, reflecting regular-season endowments.

And that's it for now...
permaximum
Posts: 416
Joined: Tue Nov 27, 2012 7:04 pm

Re: Kobe Bryant and All-Time Ranking of Players

Post by permaximum »

I'm highly opposed to the idea of using any kind of all-in-one metric to make a greatest of all time list while they were proven not good enough over and over again in each retrodiction test accounting for roster turnover. I believe making a list by valuing opinions of people that watches, coaches, plays basketball to reach a consensus would be a strongly more reliable route. We can't objectively decide which one's opinion is closer to the truth but with a sample that's big enough, the list should be closer to the reality as long as there are some basic requirements to be included in that sample.

This brings me to the individual awards. Particularly, regular-season MVP votes. The voters pass the basic requirements to be included in the sample and the sample is large enough to rely on it. I believe, percent approach would be better instead of going additive since we're valuing greatness of a player while he was on the court regardless of how many years he played. The thing to look at would be how to value the years a player got a vote and not. I have something in my mind. However since we're interested in greatness this problem can be solved by a simple logic that if a guy's never considered a top 5 player at any time by any voter even if he was the 6th guy in all his career, he doesn't pass the requirement to be on the list.

Still I believe a list can be made with the above approach and it would be much closer to the reality than any all-in-one metric's list.
Post Reply